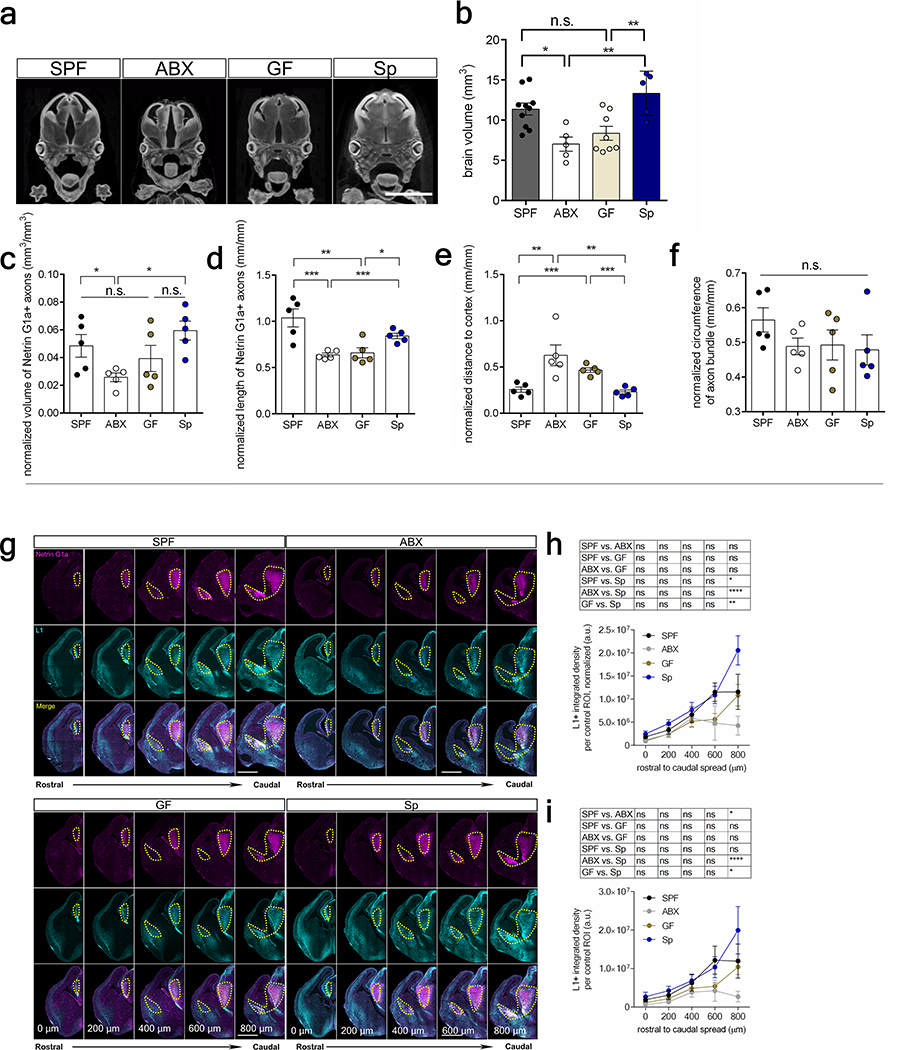
Extended Data Fig. 3|. Whole brain volume and L1+ thalamocortical axons in E14.5 brains of offspring from gnotobiotic dams.
a, Micro-computed tomography of E14.5 fetal brain. Scale bar=2 mm. b, Whole fetal brain volume of E14.5 offspring from SPF, ABX, GF and Sp dams. (One-way ANOVA+Tukey’s, n=10, 5, 8, 5 dams). c, Volume of Netrin-G1a axons, normalized to E14.5 SPF, ABX, GF, and Sp whole brain volume. (SPF v ABX: two-tailed Mann-Whitney, SPF v GF, GF v Sp, and ABX v Sp: One-way ANOVA+Tukey’s, n=5 offspring from different dams). d, Length of Netrin-G1a axons, normalized to the cubic root of E14.5 SPF, ABX, GF, and Sp whole brain volume. (SPF v ABX and SPF v GF: One-way ANOVA+Tukey’s, Sp v ABX and Sp v GF: two-tailed Mann-Whitney, n=5 offspring from different dams). e, Distance from rostral tip of Netrin-G1a axon to cortex, normalized to the cubic root of E14.5 SPF, ABX, GF, and Sp whole brain volume. (SPF v ABX and Sp v ABX: One-way ANOVA+Tukey’s, SPF v GF and Sp v GF: two-tailed Mann-Whitney, n=5 offspring from different dams). f, Circumference of Netrin-G1a axonal bundle at the internal capsule (IC), normalized to the cubic root of E14.5 SPF, ABX, GF, and Sp whole brain volume. (One-way ANOVA-Tukey’s, n=5 offspring from different dams). g, Netrin-G1a (magenta) and L1 (cyan) in E14.5 SPF, ABX, GF and Sp brain sections. Scale=500 μm. Yellow lines=matched control ROI. h, L1 per matched control ROI, normalized by total brain area in E14.5 SPF, ABX, GF and Sp brain sections. (Two-way ANOVA+Tukey’s, n=5 dams). i, L1 per matched control ROI in E14.5 brain sections of offspring from SPF, ABX, GF and Sp dams. SPF, ABX, GF, and Sp data are as in Figure 1d and 2e. (Two-way ANOVA+Tukey’s, n=5 dams). Mean±SEM, *p<0.05, **p<0.01, ****p<0.0001, n.s.=not statistically significant.

