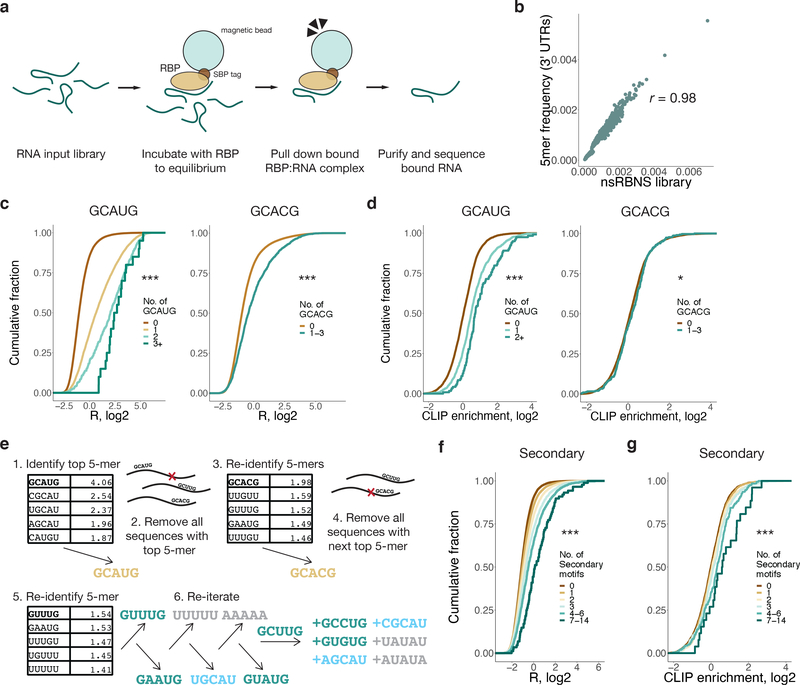
Figure 1. 3' UTR natural sequence nsRBNS (nsRBNS) with RBFOX2 captures variation in binding affinity.
a. Schematic of nsRBNS. Recombinant protein is incubated with a designed RNA library to equilibrium and bound RBP:RNA complexes are purified. Oligonucleotides are sequenced and the enrichment (R) value is calculated ((reads per million)input/(reads per million)pulldown). b. nsRBNS 5mer frequencies correlated with 5mer frequencies of the 3' UTR transcriptome (n = 1024 5mers). Pearson correlation. c. Distribution of R for nsRBNS sequences containing 0 (n = 49931), 1 (n = 5586), 2 (n = 392), or 3+ (n = 22) Rbfox GCAUG motifs and 0 (n = 54637) or 1–3 (n = 1294) GCACG motifs *** P < 0.001 between lowest and highest counts (two-sided Wilcoxon Rank-Sum test). d. Distribution of enrichment of RBFOX2 eCLIP reads in HepG2 cells with increased motif count for 0 (n = 8004), 1 (n = 1244), or 2+ (n = 118) GCAUG motifs and 0 (n = 9065) or 1–3 (n = 301) GCACG motifs in transcriptomic regions corresponding to those in nsRBNS library (normalized to IgG control). *** P < 0.001, * P < 0.05 between lowest and highest counts (two-sided Wilcoxon Rank-Sum test). e. An iterative method discovers moderate binding by RBFOX2 to six motifs of the sequence format GHNUG (teal) beyond two known Rbfox motifs (gold). After nine rounds of enrichment analysis, remaining GNNUG 5mers (teal) were also included as secondary motifs, while AU-rich (grey) and shifted (light blue) 5mers were excluded from subsequent analyses. f. Distribution of R for nsRBNS sequences containing 0 (n = 25501), 1 (n = 18682), 2 (n = 7957), 3 (n = 2576), 4–6 (n = 1069), or 7–14 (n = 146) secondary motifs. *** P < 0.001 between lowest and highest counts (two-sided Wilcoxon Rank-Sum test). g. Distribution of enrichment of RBFOX2 eCLIP reads in HepG2 cells at 0 (n = 3922), 1 (n = 3188), 2 (n = 1453), 3 (n = 498), 4–6 (n = 262), or 7–14 (n = 43) secondary motifs at library positions in the transcriptome (normalized to IgG control). *** P < 0.001 between lowest and highest counts (two-sided Wilcoxon Rank-Sum).

