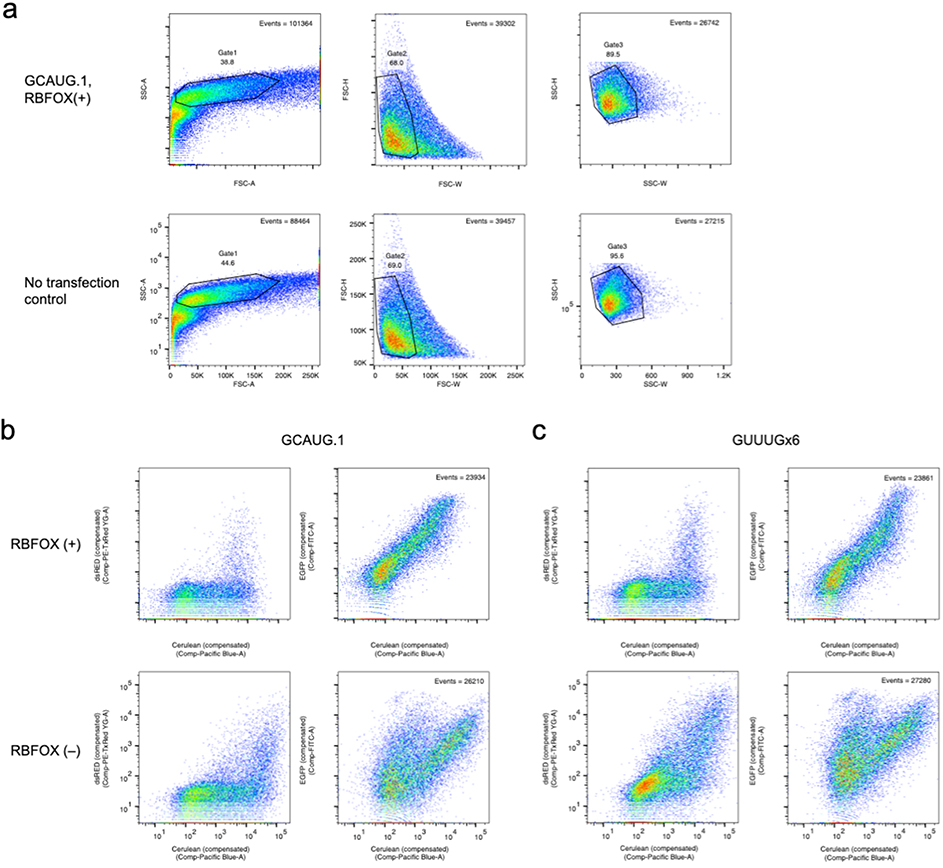
Extended Data Figure 5. Representative raw data from flow cytometry.
Graphs were drawn with pseudocolor in FlowJo. a. Gating strategy to select for single, live, intact cells. Events were gated through three serial gates to obtain approximately 25000 events for downstream analysis. Total number of events in each graph, and the percentage of events within the gate in each graph are shown. (FSC: forward scatter; SSC: side scatter; A: area; H: height; W: width.) b,c. Compensated values of the three fluorophores used (dsRED, EGFP, Cerulean), in positive and control samples with (b) primary and (c) secondary motifs.

