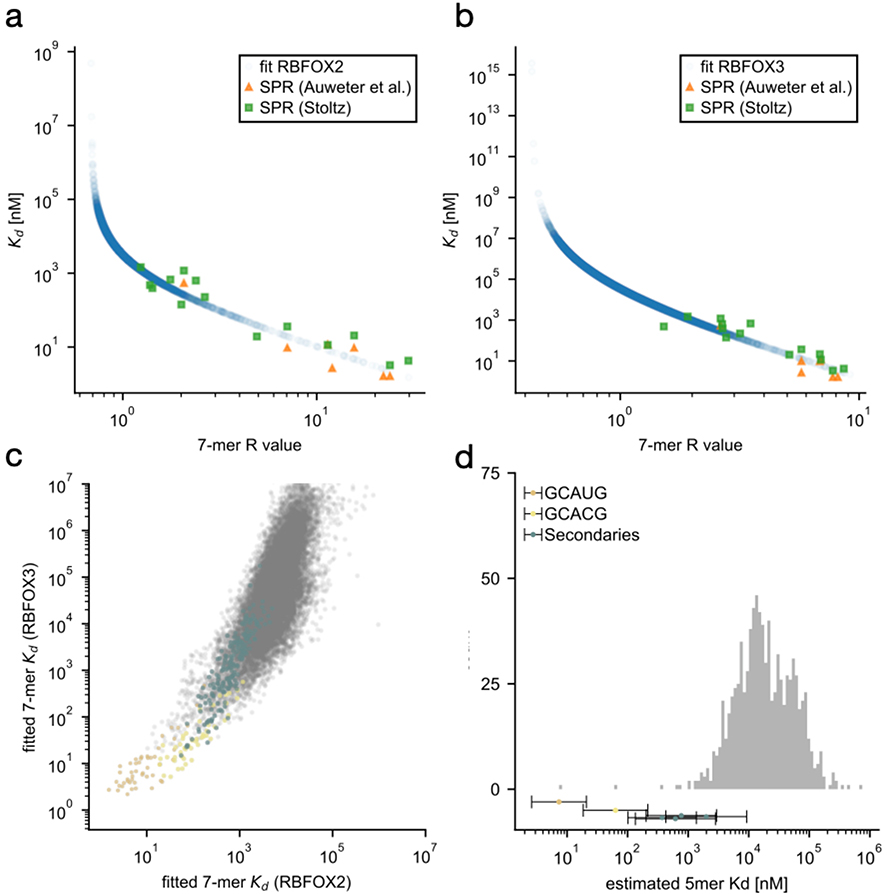
Extended Data Figure 9. Affinity estimation of Rbfox secondary motifs.
RBNS 7-mer enrichments (R-value) for 1.1 μΜ RBFOX2 (a) and 1.3 μΜ RBFOX3 (b) binding were first corrected for non-specific contributions (R’ see Methods) and then linearly correlated with known dissociation constants (Kd) for RBFOX1 binding1,2. Correlation coefficients between log(R’) and log(Kd) were r=-0.955, P-value=8.379 × 10⁻⁹ (a) and r=−0.915, P-value=6.7 × 10⁻⁷ (b). Scatter plots show estimated Kd as a function of the original, uncorrected R-value. Resulting 7-mer Kd estimates were highly correlated between RBFOX2 and RBFOX3 (c) with r=0.763, P-value ≈ 0. Data for all 7-mers are shown on a logarithmic scale. Primary motif containing 7-mers are highlighted in gold (GCAUG), yellow (GCACG), and teal (secondary motifs GCUUG, GAAUG, GUUUG, GUGUG, GUAUG, GCCUG). Grouping 7-mers by their 5-mer content allows to estimate average Kds for each 5-mer (see Methods). A histogram of these 5-mer dissociation constants is shown in (d), with primary and secondary motifs highlighted as in (c). Motifs GCUUG, GAAUG and GUUUG were considered strong motifs. 136 non-primary or secondary 5-mers with partial overlap to primary motifs GCAUG, GCACG were excluded.

