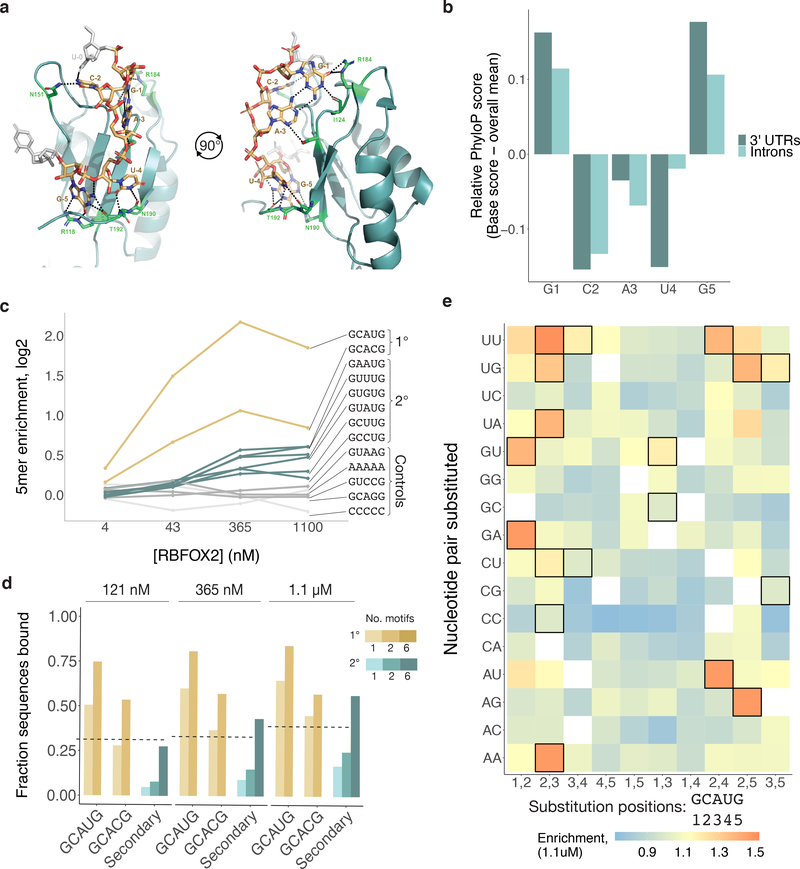
Figure 2. Rbfox proteins reproducibly bind a class of secondary motifs with moderate affinity.
a. Ribbon structure of RBFOX1 (teal) bound to UGCAUG (gold). Generated with data from Auweter et al.41 (PDB 2ERR). Protein–RNA hydrogen bonds are indicated in black. b. Relative per-base conservation, as represented by PhyloP score, for each position of GCAUG at all instances of the motif in 3' UTRs (dark teal, n = 26707) and introns (light teal, n = 91791). c. Primary (gold), secondary (teal), polyA and polyC (light grey), and GCAGG, GUAAG, and GUCCG (dark grey) R values are shown across four concentrations of RBFOX2 nsRBNS experiments. d. Analysis of the fraction of oligonucleotides bound in nsRBNS at three concentrations of RBFOX2 for primary (gold (GCAUG and GCACG), nGCAUG-1 = 5435, nGCAUG-2 = 384, nGCACG-1 = 1246, nGCACG-2 = 30) and secondary (teal, nSecondary-1 = 15676, nSecondary-2 = 6722, nSecondary-6 = 64) motifs. An oligonucleotide was considered bound if it had an R value of at least 1.1. e. nsRBNS R values at 1.1 μM RBFOX2 concentration for all pentamers diverging from GCAUG or GCACG by 1 or 2 bases. Secondary motifs identified here are outlined in black.

