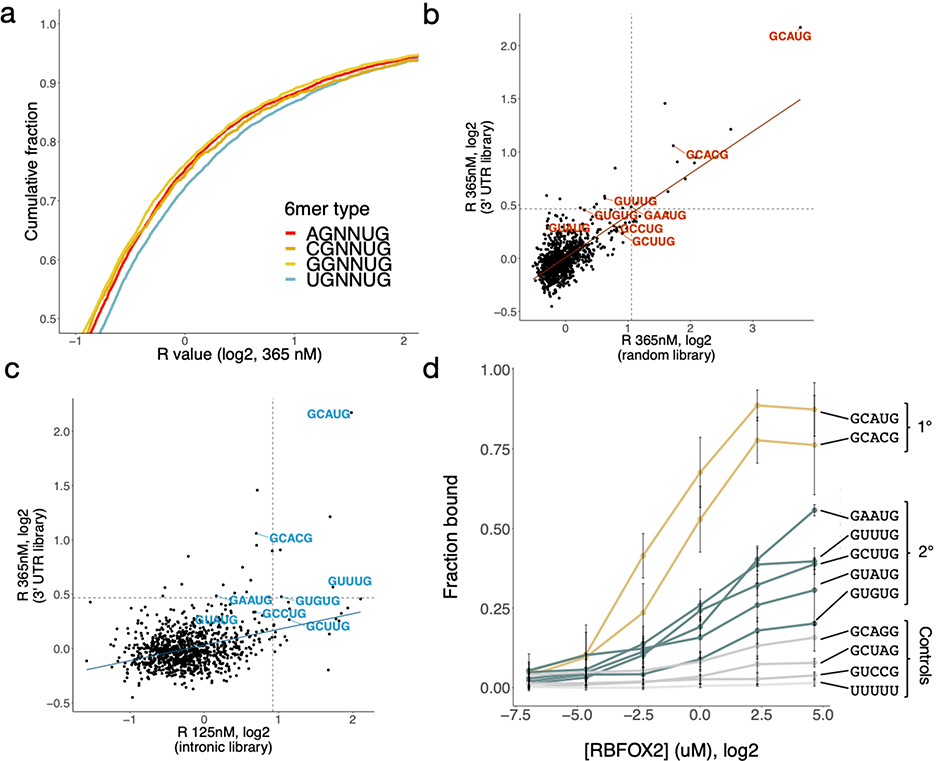
Extended Data Figure 2. Different nsRBNS libraries emphasize different 5mer binding preferences for RBFOX2.
a. R value distribution of nsRBNS sequences containing 1–2 copies of different 6mer classes UGNNUG (n = 7725), CGNNUG (n = 1751), AGNNUG (n = 6260), GGNNUG (n = 4935). b-c. Comparison of random (b) and intronic natural sequence (c) RBNS with 3' UTR nsRBNS 5mer enrichments. Primary and secondary motifs are labelled in red and blue, respectively. Dotted lines show 2.5 standard deviations above the mean. d. Filter binding with radiolabeled oligonucleotides containing three copies of the indicated sequence brought to equilibrium with six concentrations of RBFOX2. Primary motifs in gold, secondary motifs in teal, controls in grey. Error bars indicate +/− SD for three replicates.

