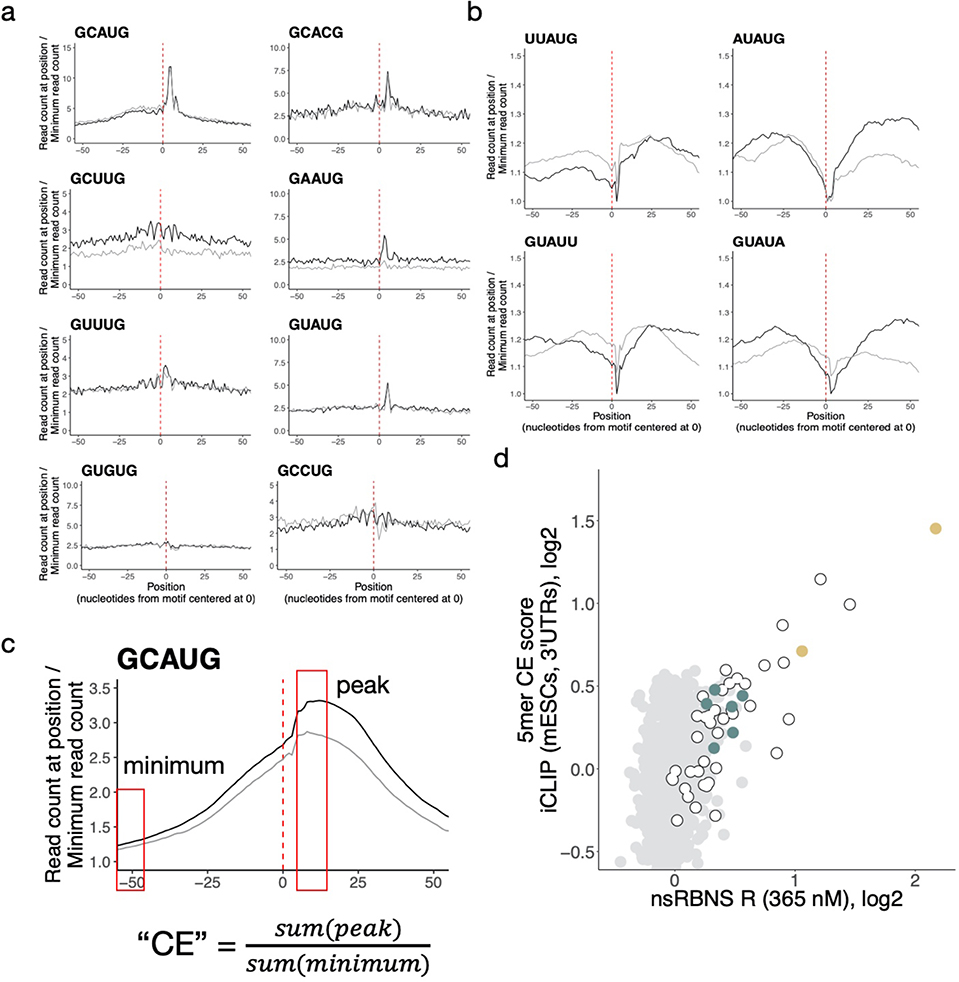
Extended Data Figure 3. RBFOX2 iCLIP demonstrates broad agreement with nsRBNS.
a. Some secondary motifs show sharp peaks near 0 in a metaplot centered at the motif in introns (black) and 3' UTRs (grey) in RBFOX2 iCLIP data27. 5' ends of iCLIP reads containing the motif of interest were aligned with position one of the pentamer at 0 and normalized to the minimum read count in an 80-nt window (50-nt window shown). Y-axis range was reduced for secondary motifs. See Methods for read counts. b. AU-rich nsRBNS motifs do not show characteristic read peaks near 0 in a metaplot centered at the motif in introns (black) and 3' UTRs (grey) in RBFOX2 iCLIP data27. iCLIP reads containing the motif of interest were aligned with position one of the pentamer at 0 and normalized to the minimum read count in an 80-nt window (50-nt window shown). Y-axis range was reduced for secondary motifs. See methods for read counts. c. Schematic showing the generation of a clip enrichment (CE) score from iCLIP data. After generation of a metaplot, the read count at the peak apex was divided by the read count at its lowest point to generate a CE score analogous to an enrichment. d. Correlation of iCLIP- and nsRBNS-enriched 5mers in 3' UTRs (n = 1024). CLIP enrichment (CE) scores were computed for iCLIP peaks. Secondary motifs indicated in teal, primary motifs indicated in gold.

