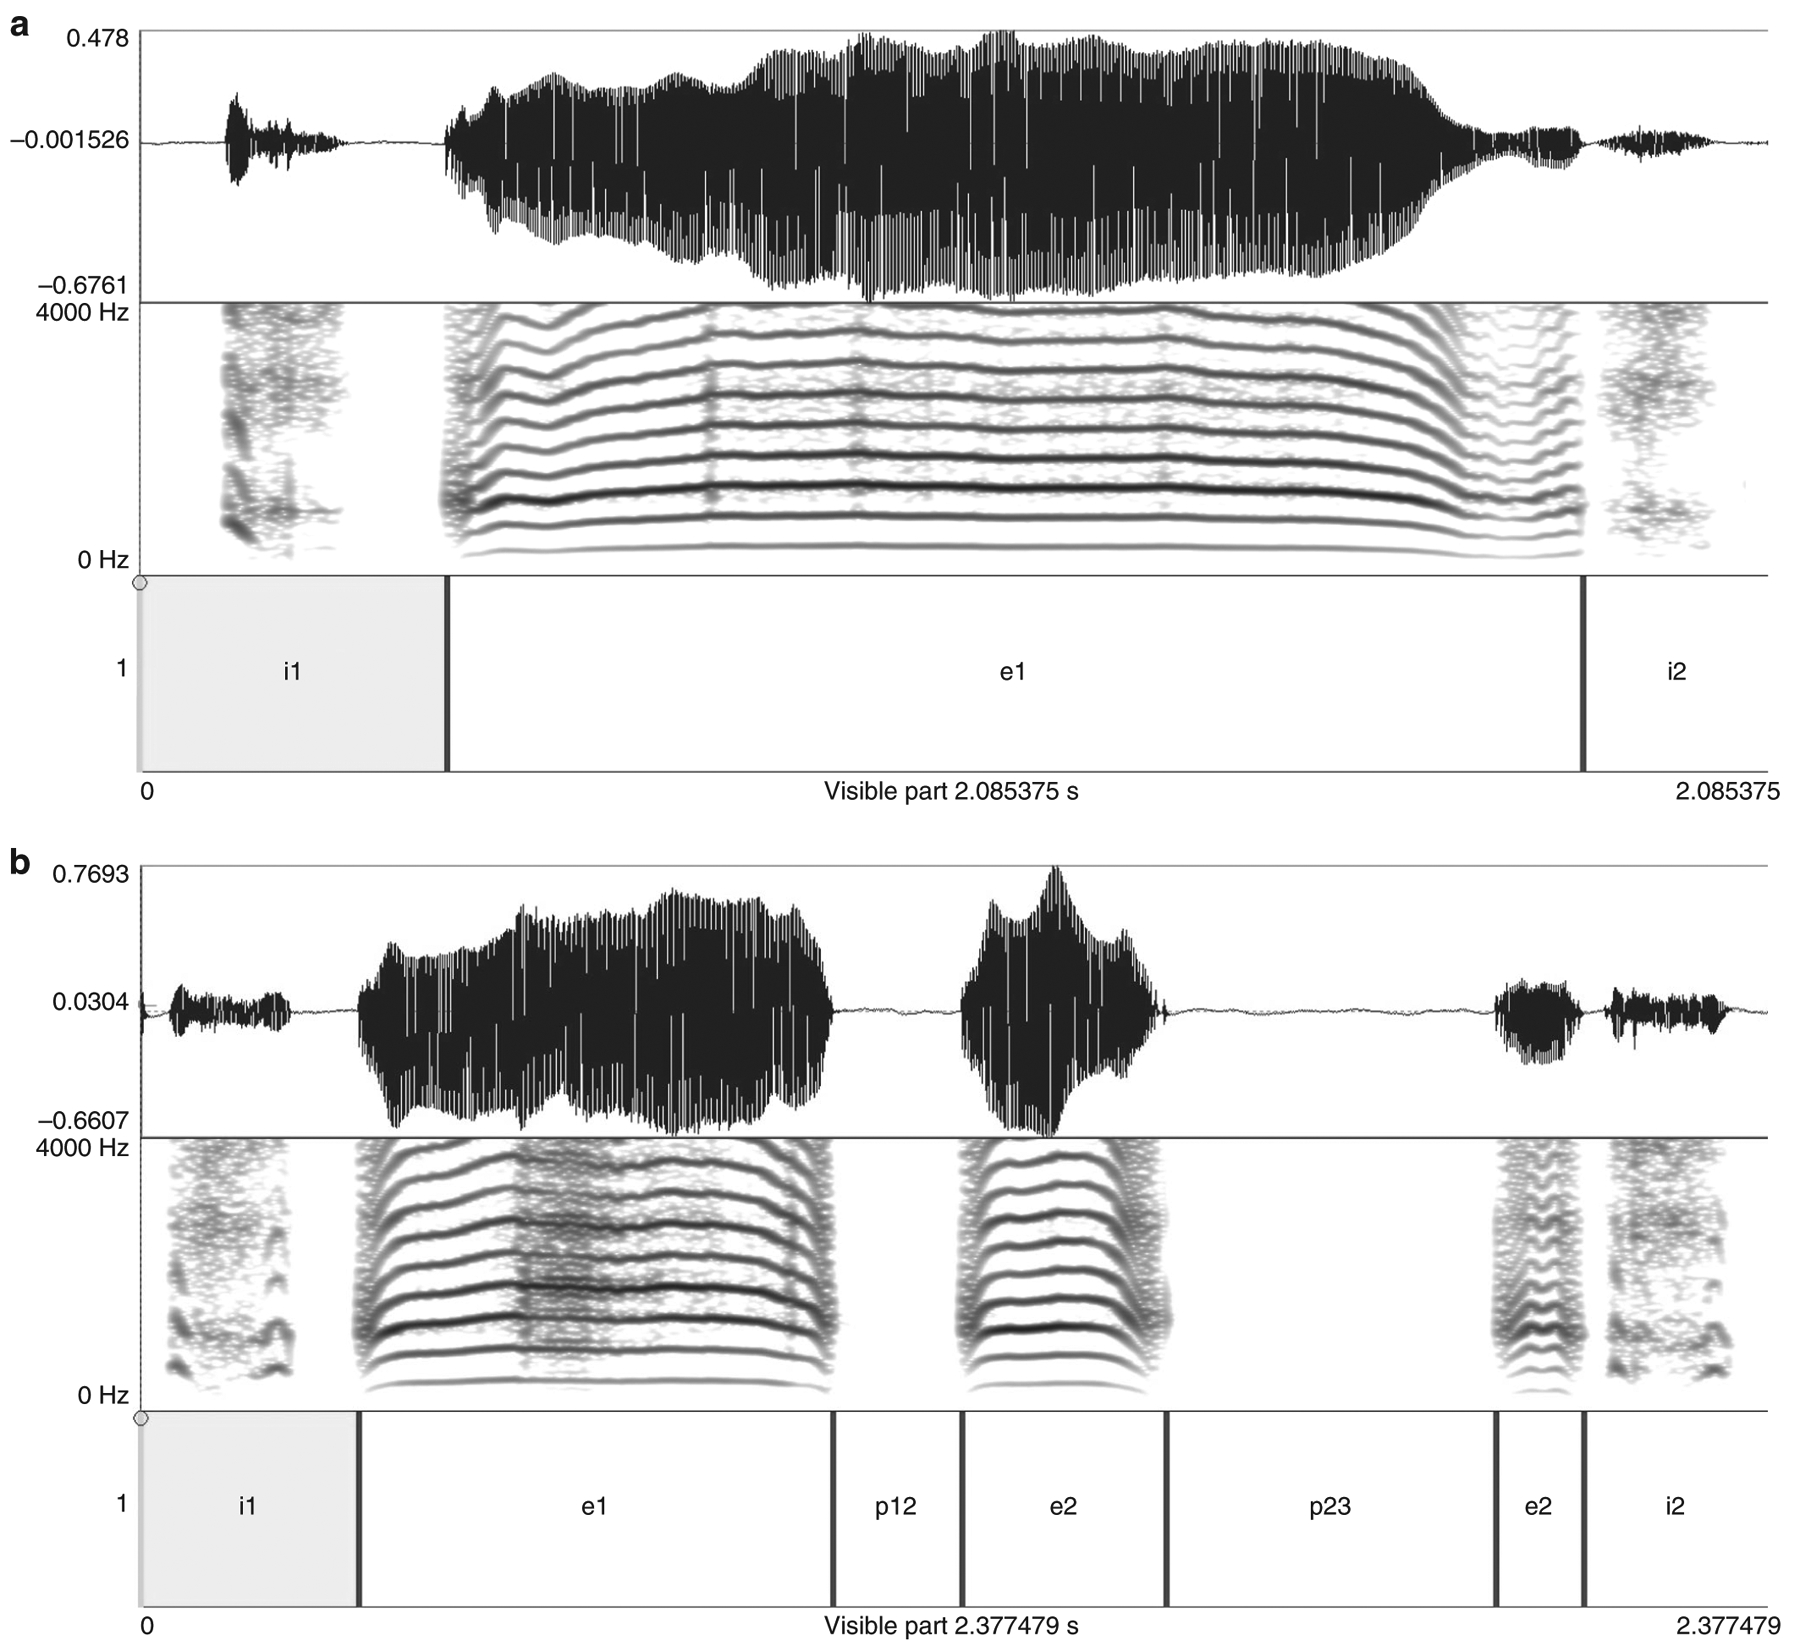
Fig. 1.

PRAAT display of a cry utterance a without and b with a two-fold melody breaking. For each figure, the top is a time representation of the original wav-file. The middle is a frequency spectrogram (lowest band = melody). The bottom is an annotation of time intervals for automatic extraction of temporal features (inspiratory intervals are marked by i#, expiratory elements are marked by e#, melody breaks are marked by p# [pauses]).
