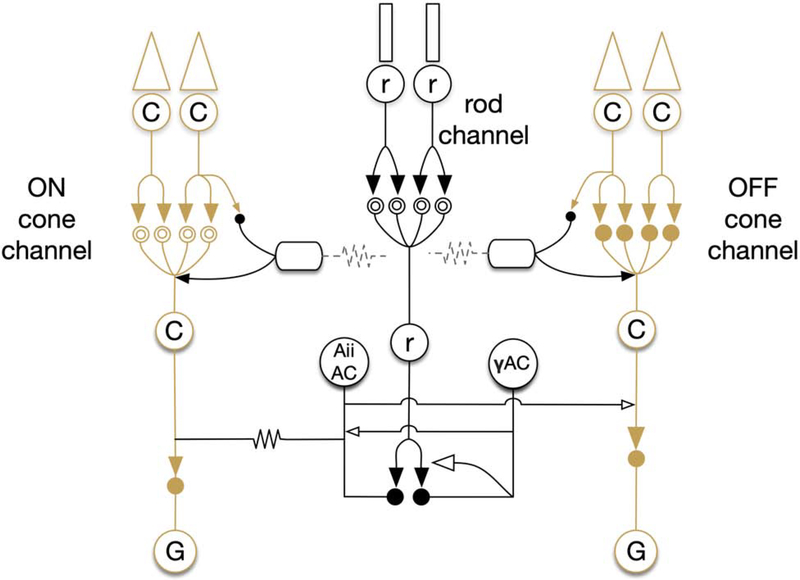
Figure 2:
Simple diagram of bipolar cell network. Solid arrows indicate glutamatergic synapses. Open arrows indicate inhibitory synapses (GABA or glycine). Solid circles indicate ionotropic glutamate receptors, while mGluR6 is indicated by the double open circles. Gap junctions are indicated by zig-zag lines.

