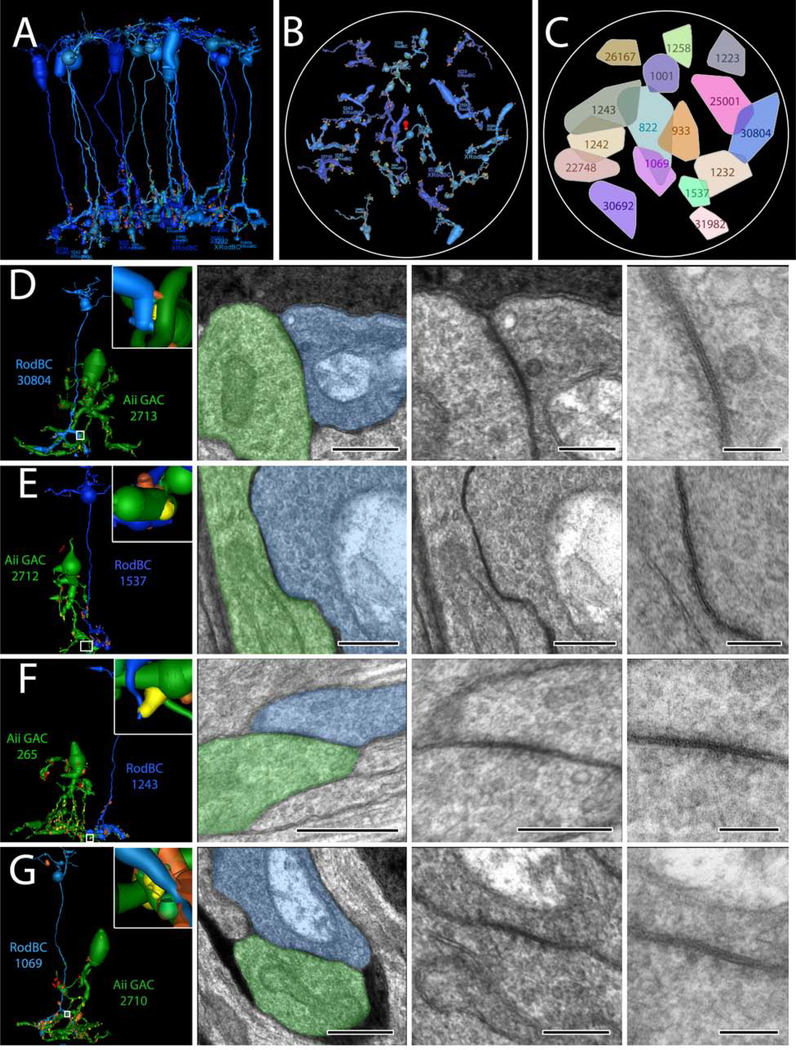
Figure 5:
RodBC gap junctions with Aii GACs (A) 3D rendering of all 16 RodBCs from RPC1. (B) RodBC axonal arbor fields in RPC1. (C) Convex Hulls of all RodBCs in RPC1 (D-E) Gap junctions between RodBCs and Aii GACs. Left panel is 3D rendering with inset higher magnification image of specific gap junction annotations. White boxed image corresponds to white box in adjacent left panel. * indicate ribbons and # indicates gap junctions arising in same varicosity. 100nm scale images are 25k recaptures of gap junction structures.

