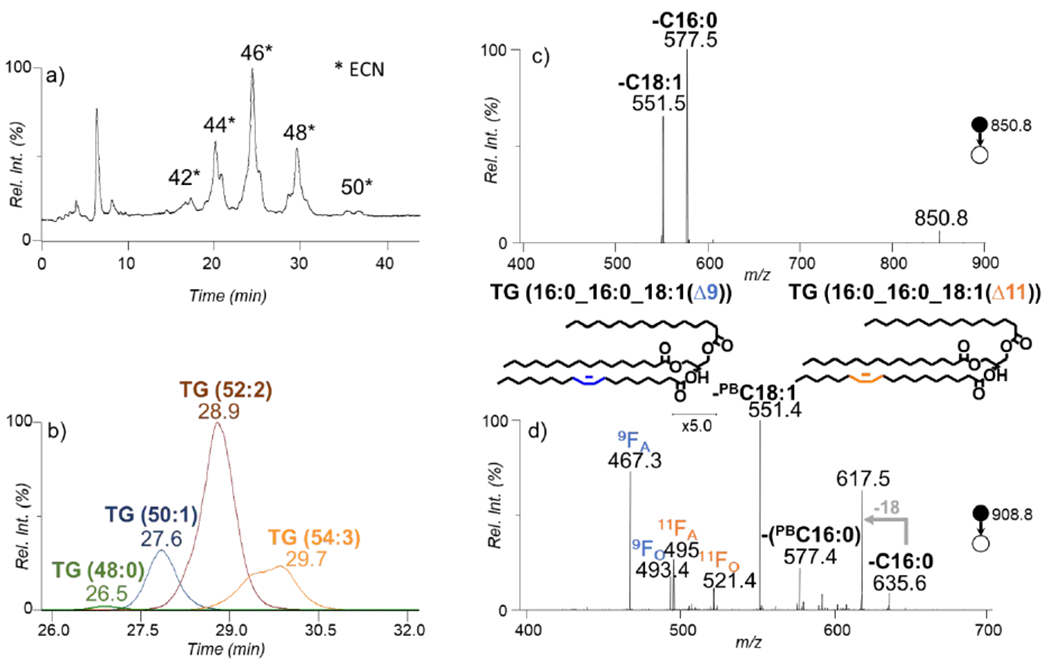
Figure 2.

a) Total ion chromatograph (TIC) of the reversed phase separation of pooled human plasma in positive ionization mode. b) The overlaying XIC of the corresponding to the species with an ECN of 48 from panel a) (m/z 824.8, m/z 850.8, m/z 876.8, m/z 902.8). c) The MS2 CID spectrum of the ions at m/z 850.8 shown as the blue trace at time 27.6 minutes in panel b). d) The CID spectrum of the mass corresponding to the PB product of ions at m/z 850.8 at m/z 908.8.
