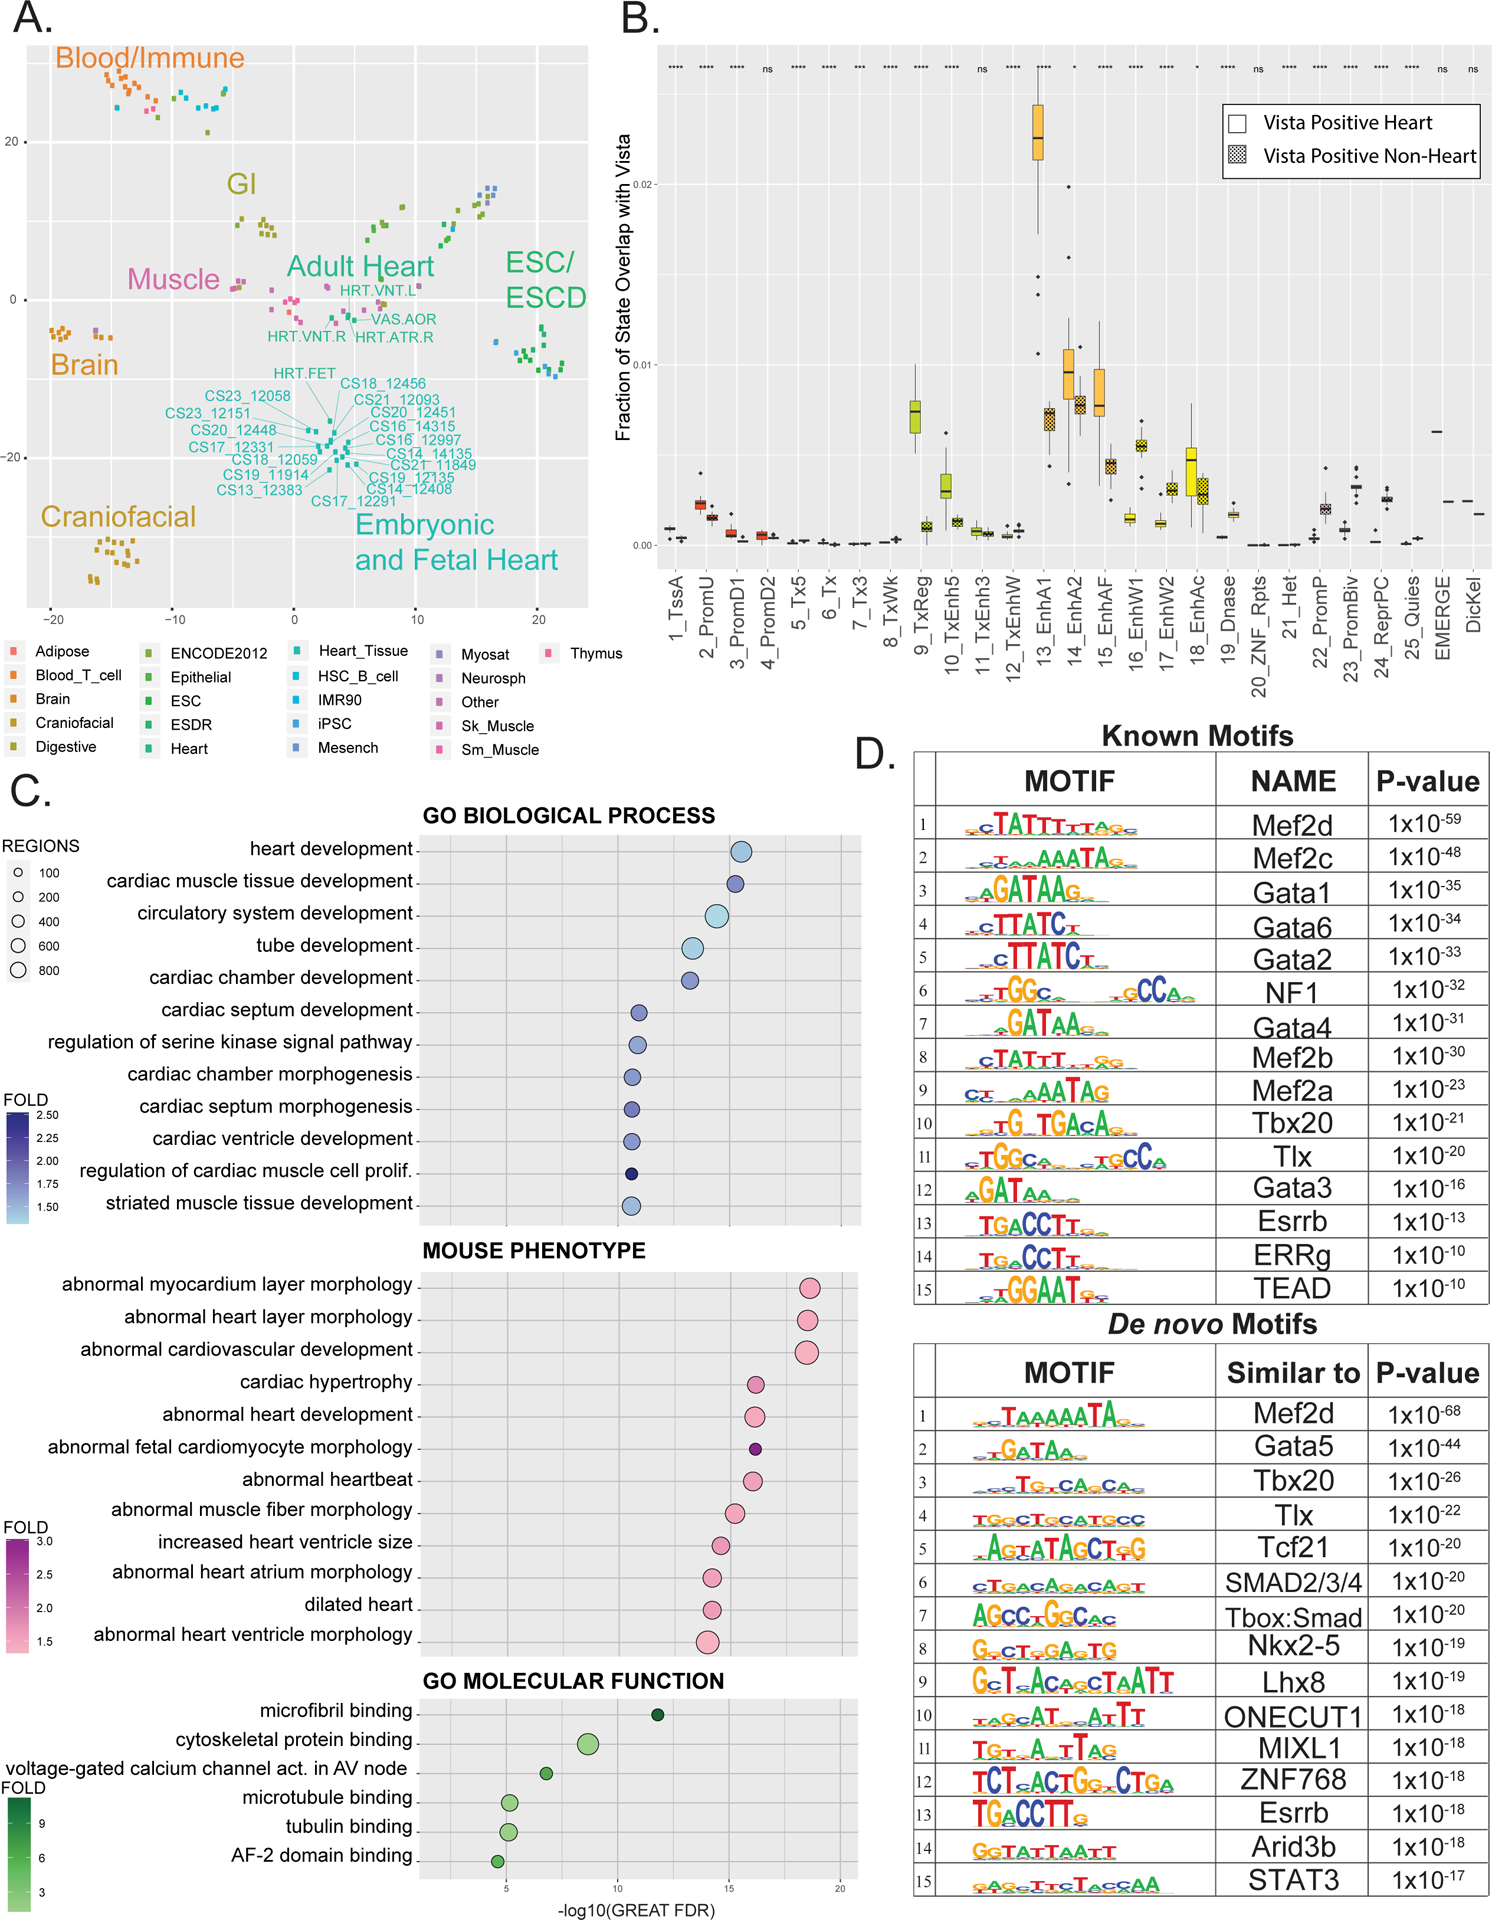
Figure 2. Multi-tissue comparisons of global enhancer activation and enrichment of heart phenotype in enhancer segments.

A. tSNE projection of imputed H3K27ac p-value signals at 444,413 enhancer segments from tissues profiled by Roadmap Epigenome and in this study. Dots are color coded by tissue as indicated and labelled as each individual tissue samples as profiled by Roadmap epigenome or in this study. B. Fraction of each of the 25 ChromHMM States, EMERGE, and Dickel datasets that overlap with either active heart enhancers (unshaded) or enhancers active in tissues other than heart (shaded) as tested by the Vista Enhancer Browser (enhancer.lbl.gov). Significance of difference of overlap between heart and other tissue were calculated using the Mann-Whitney test and is shown at top (p-value ≤ 0.05 = *, ≤ 0.01= **, ≤ 0.001= *** , ≤ 0.0001 = ****) C. Gene ontology enrichments for indicated functional categories for putative novel strong enhancer segments identified in human embryonic heart versus Roadmap Epigenome (n=12,395). Putative enhancers were assigned to genes and significance determined by GREAT. Position of each dot is based on -log10(Binomial FDR) and colored by binomial fold enrichment calculated by GREAT. D. Top most significantly enriched motifs in putative EHEs calculated by HOMER. Shown are position weight matrix for each motif, transcription factor predicted to bind that motif, and HOMER p-value (Upper panel) HOMER known motifs (Lower panel) de novo motifs.
