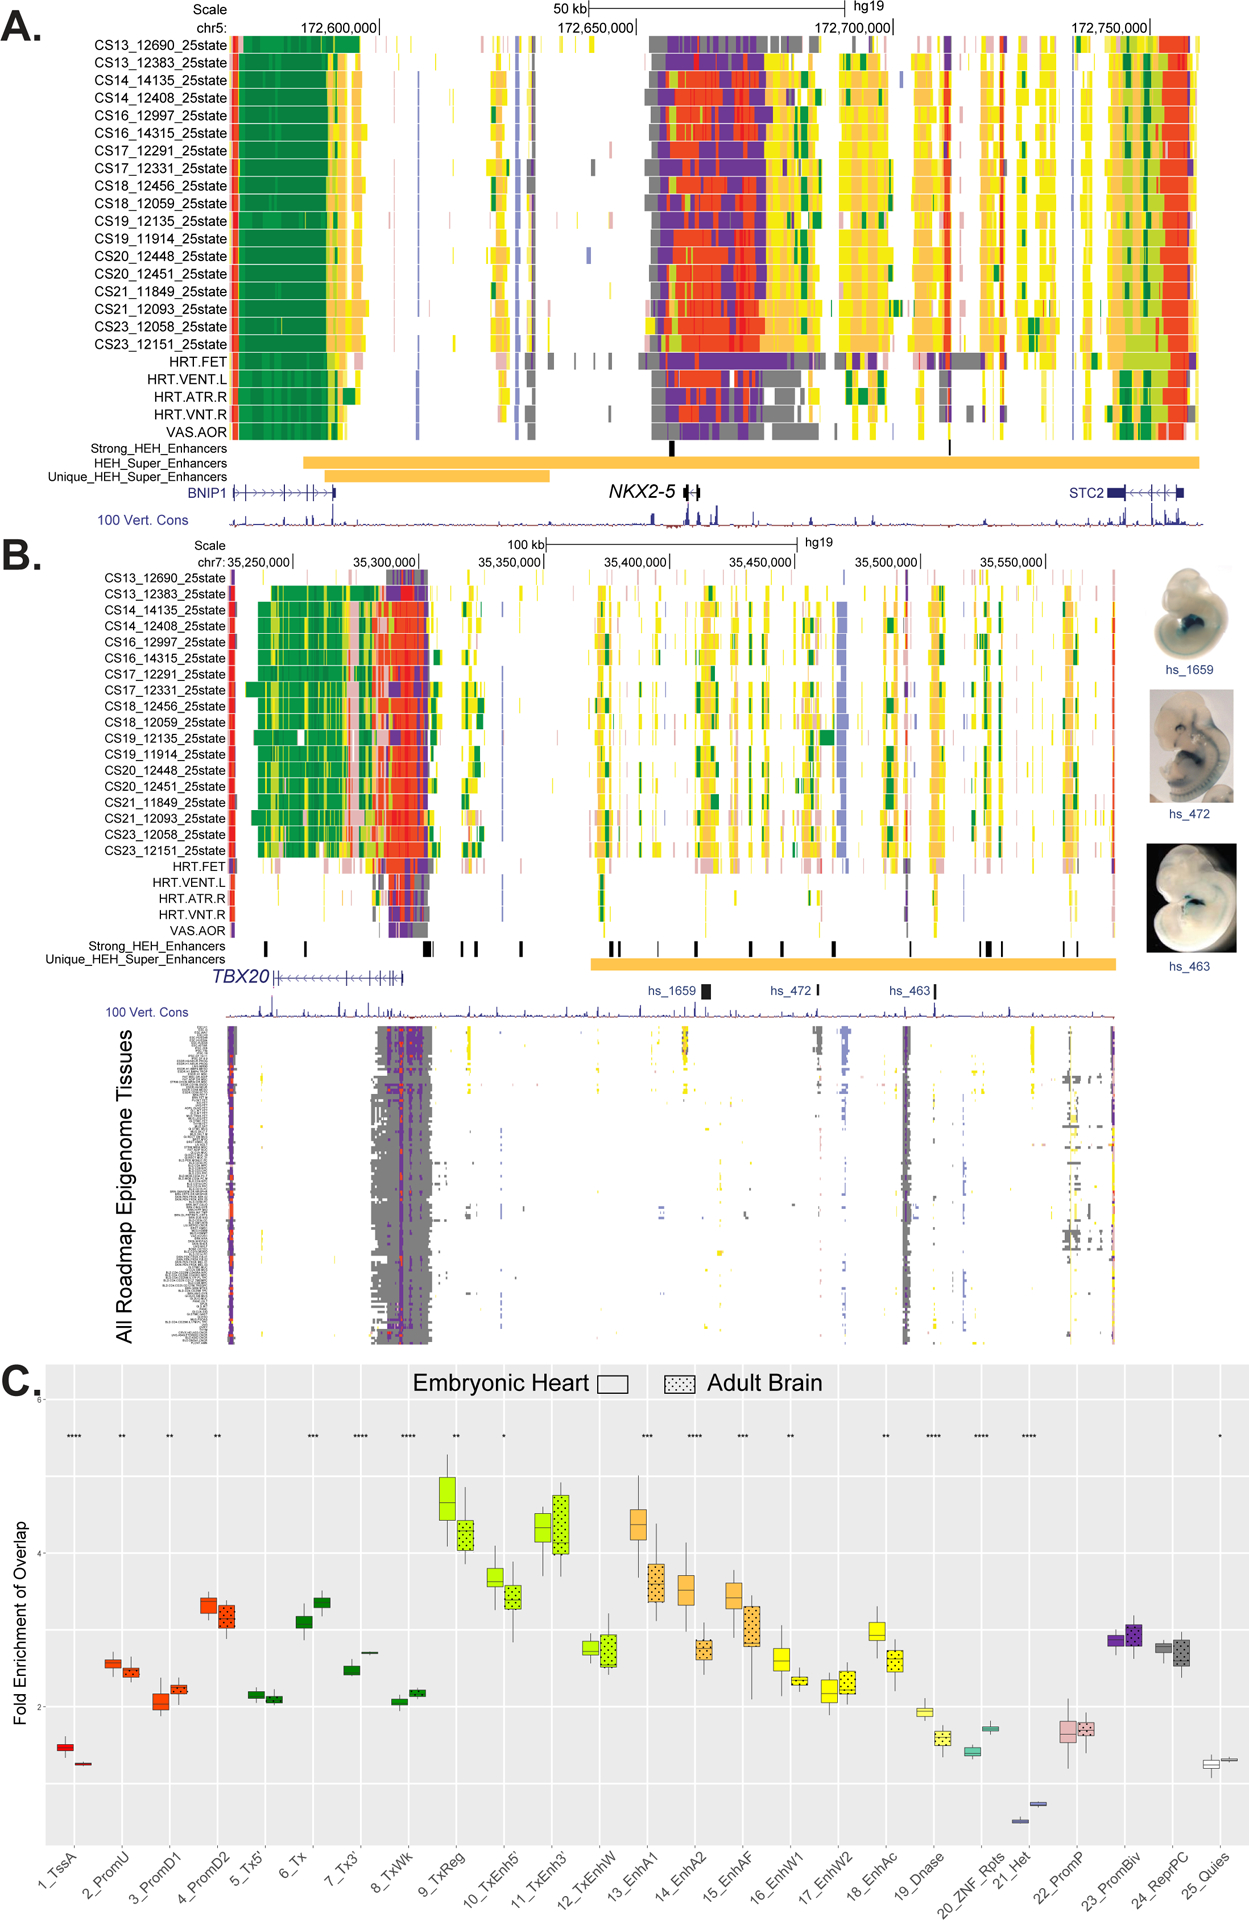
Figure 4. Functional annotation of cardiac phenotype associated variants and enrichment of embryonic heart enhancers in cardiac relevant long-range chromatin interactions.

A. UCSC browser shot of NKX2.5 gene locus showing individual embryo chromatin state annotations from this study and Roadmap Epigenome. Samples are ordered from top to bottom based on developmental age, earliest to latest. Chromatin states are indicated by color segments using color convention from Figure 1C. Strong human embryonic heart (HEH) enhancers are shown in black and superenhancers and superenhancers unique to HEH are shown in orange. B. UCSC browser shot of locus near the TBX20 gene using the same conventions as in A. The region upstream of the TBX20 gene is a human embryonic heart specific super enhancer (orange bar). Of note are the strong HEH specific enhancer states track, as well as the experimentally validated enhancer elements with images to the right. In the lower panel, all the roadmap epigenome ChromHMM segmentations are stacked showing the region is not similarly active in any other profiled tissue. C. Box plots of fold enrichment of overlap of each indicated chromatin state in human embryonic heart or brain with anchor points identified by capture Hi-C interactions in iPSC-derived cardiomyocytes over matched randomly selected segments. Solid boxes represent embryonic heart chromatin segments while dotted boxes represent adult brain chromatin segments. Significance of difference between embryonic heart and adult brain fold enrichments were calculated using the Mann-Whitney test and is shown at top (p-value ≤ 0.05 = *, ≤ 0.01= **, ≤ 0.001= *** , ≤ 0.0001 = ****). The largest increases in fold enrichments for embryonic heart were identified for strong enhancer states 13 and 14.
