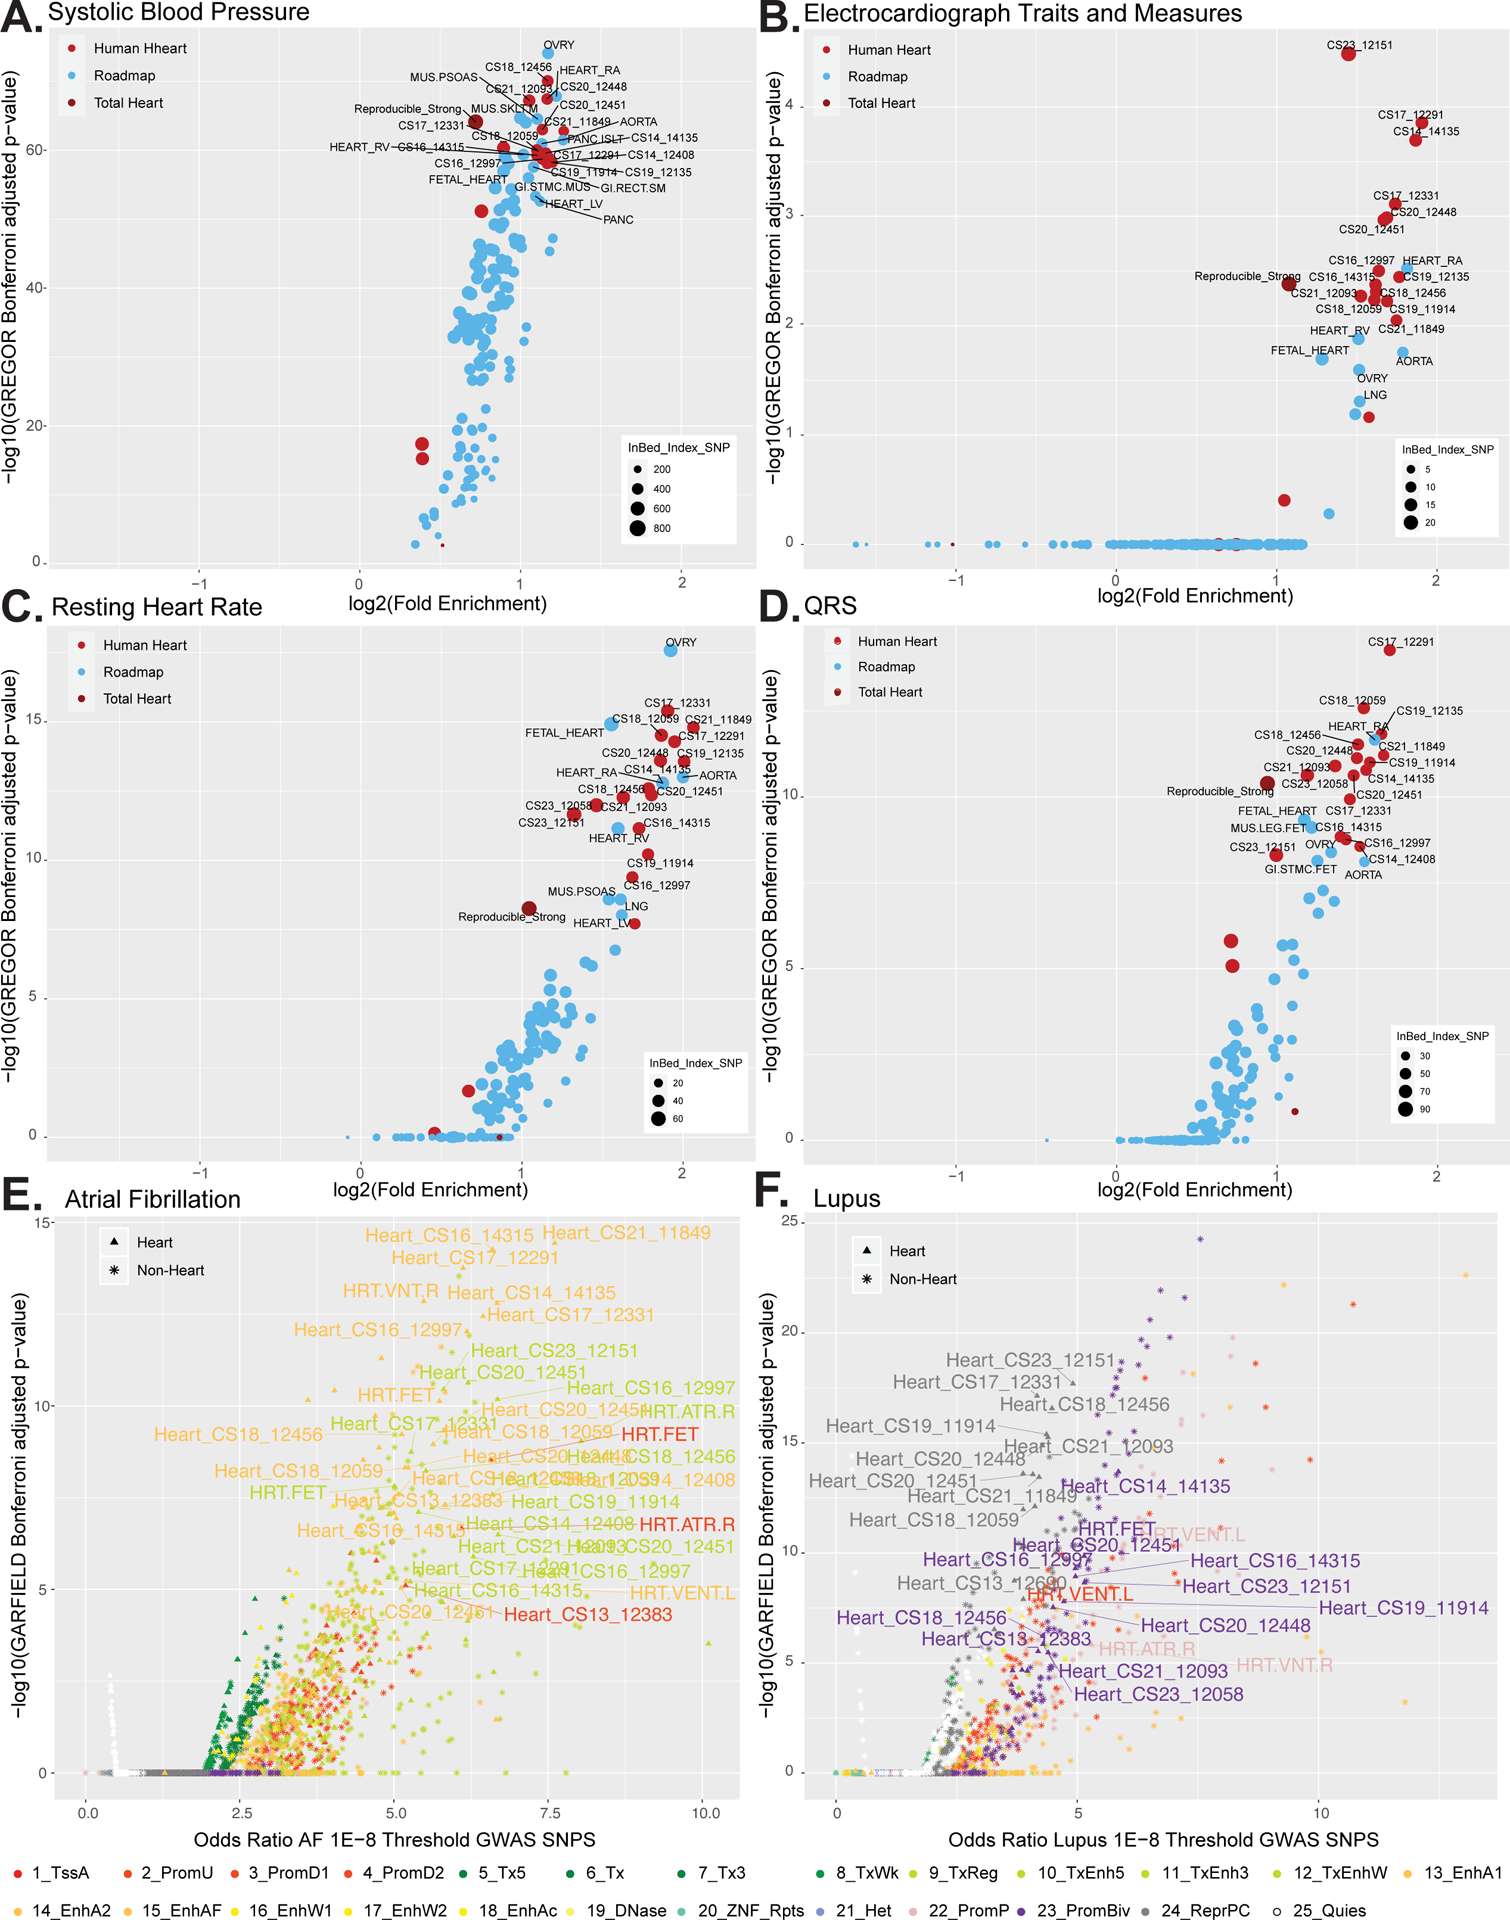
Figure 5. Enrichment of cardiac phenotype associated variants in embryonic heart enhancer segments.

A. Scatterplot of the log2 fold enrichment and log10 Bonferroni adjusted significance level of GWAS variants associated with systolic blood pressue in all enhancers segments identified in the strong enhancer states for each embryonic heart sample (bright red), the total reproducible strong enhancers from the whole dataset (dark red) or other tissues in Roadmap Epigenome (blue). All values calculated using only variants with p values < 5×10⁻⁸ from GWAS Catalog using GREGOR. B. Same as in A using GWAS variants associated with electrocardiograph traits and measures. C. Same as in A using GWAS variants associated with resting heart rate. D. Same as in A using GWAS variants associated with QRS complex traits. E. Enrichment of GWAS analysis p-values for atrial fibrillation72 in all chromatin state annotations as determined by GARFIELD. Scatterplot of the odds ratio of atrial fibrillation GWAS SNPS using the 1E–8 Threshold by the log10 GARFIELD Bonferroni adjusted p-values. Samples from this study (triangle symbol) and Roadmap epigenome (star symbol) are colored by chromatin state as indicated by the color key. Atrial fibrillation shows greatest enrichment in strong enhancers identified in embryonic heart tissues. F. Same as in E using GWAS summary statistics for systemic lupus erythematosus105. Lupus shows greatest enrichment in strong enhancers identified in immune cell types sorted from blood. Lupus also shows enrichment in repressed and bivalent states in human embryonic heart.
