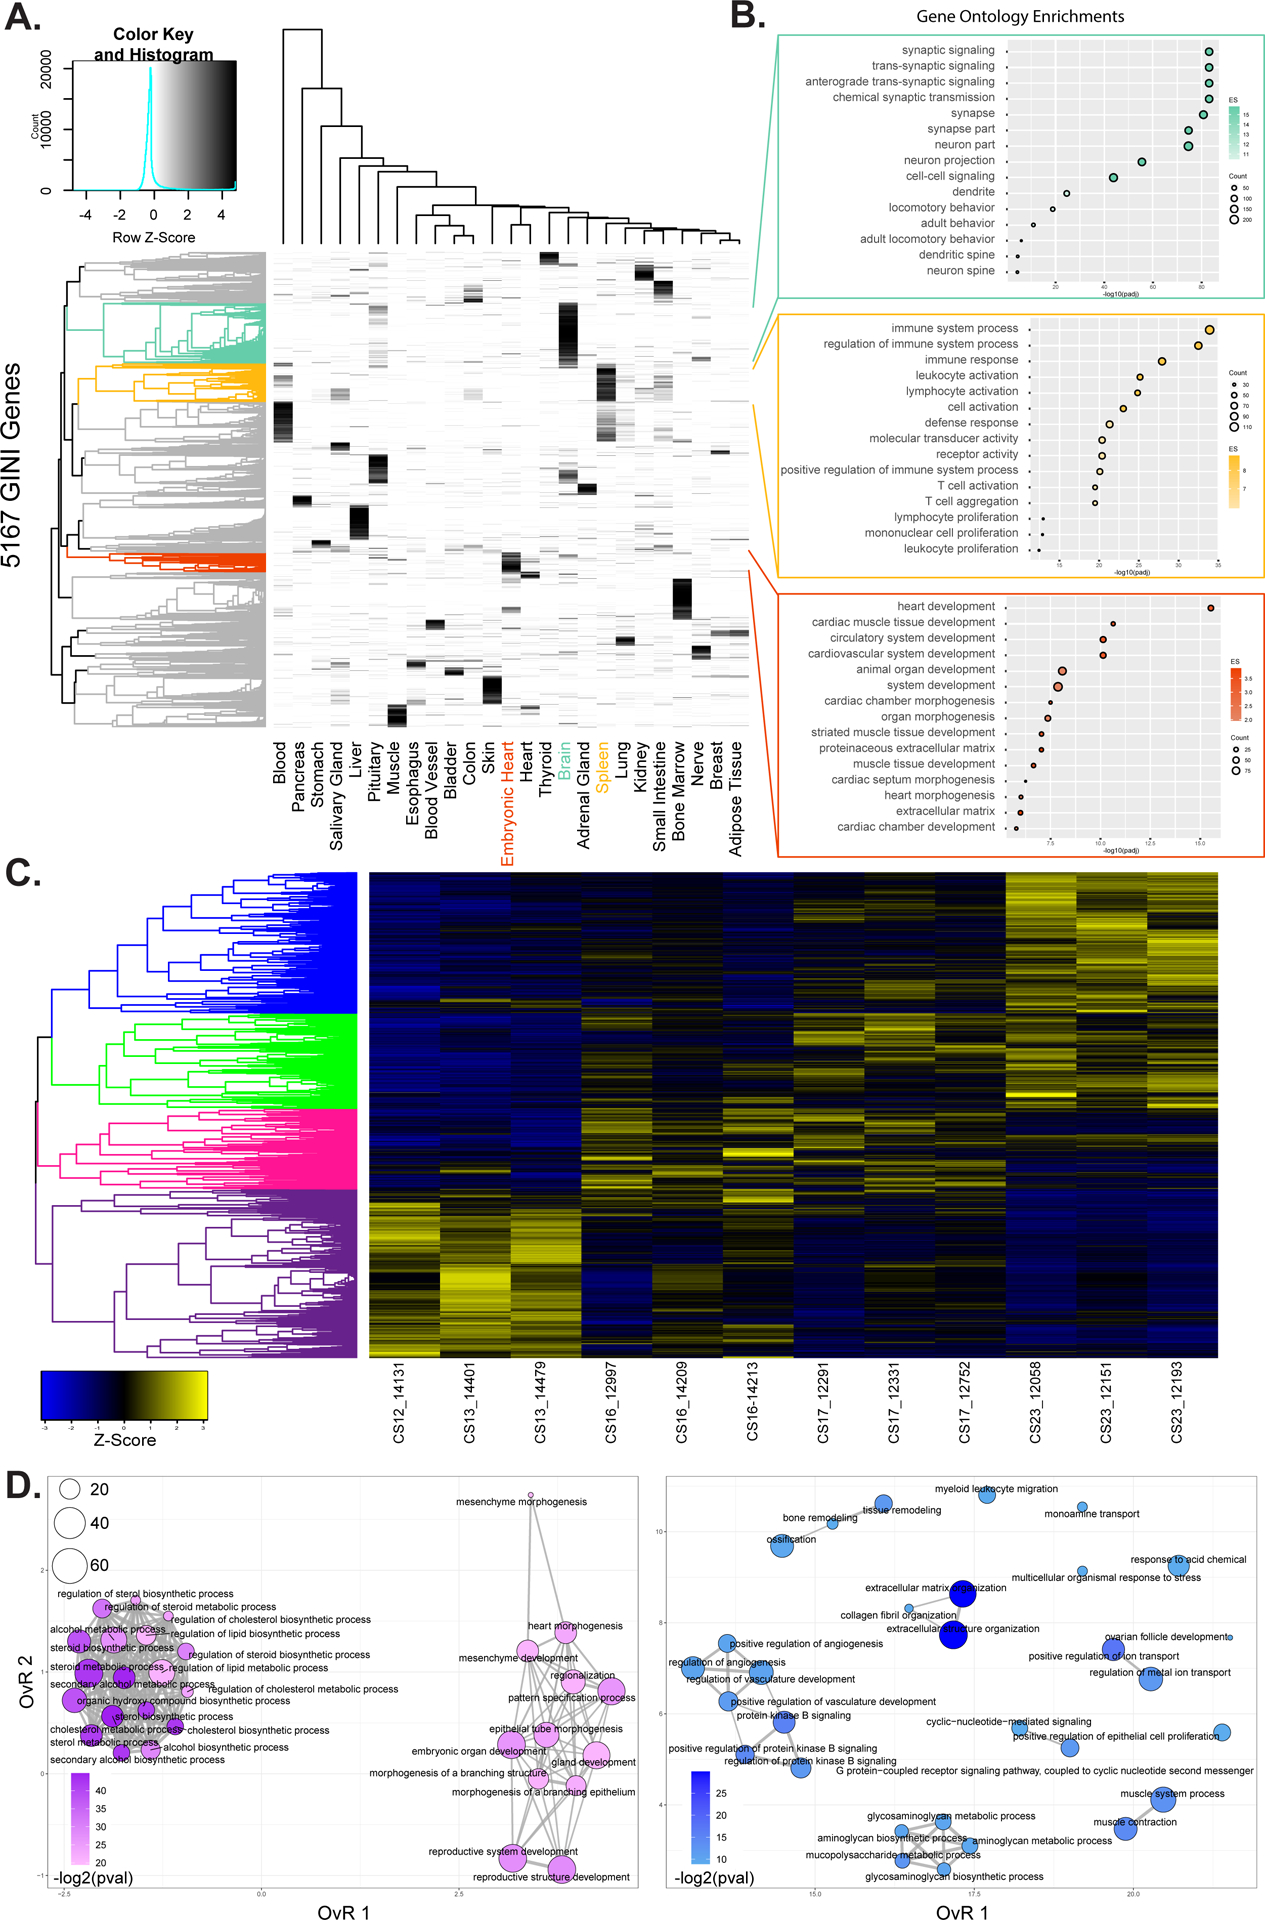
Figure 6. Transcriptional profiling of embryonic heart development.

A. Heatmap showing specificity of expression for 5,167 genes identified with elevated Gini scores (>0.5) for 25 tissues from GTEx and embryonic heart. Brain, spleen, and embryonic heart specific genes are identified as colored leaves on the dendrogram along the left of the plot. B. Gene ontology enrichments for genes identified as specific for heart, spleen, and embryonic heart respectively based on genes from indicated color coded clusters in A. C. Heatmap of z-scores of normalized gene expression for genes identified as differentially expressed in pairwise comparisons of replicates from each of Carnegie Stage in our developmental series. Dendrogram on the left is hierarchical clustering of genes across a developmental series. The genes were color coded by cutting the dendrogram at a height which would result in four groups. Purple most highly expressed early. Pink and green expressed most strongly in intermediate stages of the series. Blue genes are most strongly expressed at the end of the developmental series. D. Gene ontology enrichment maps from the purple (left) and blue (right) gene sets identified in C. The size of each dot represents the number of genes and the color scale represents the -log2 transformed Benjamini & Hochberg adjusted p-value of each ontology. Darker colors indicate higher significance. The edges connect overlapping gene sets. The location of each dot is determined by the overlap ratio (OvR) calculated by enrichplot. Genes active early are enriched for functions related to embryonic patterning and morphogenesis while genes active late in embryonic heart development are enriched for vasculature development and ion-channel function.
