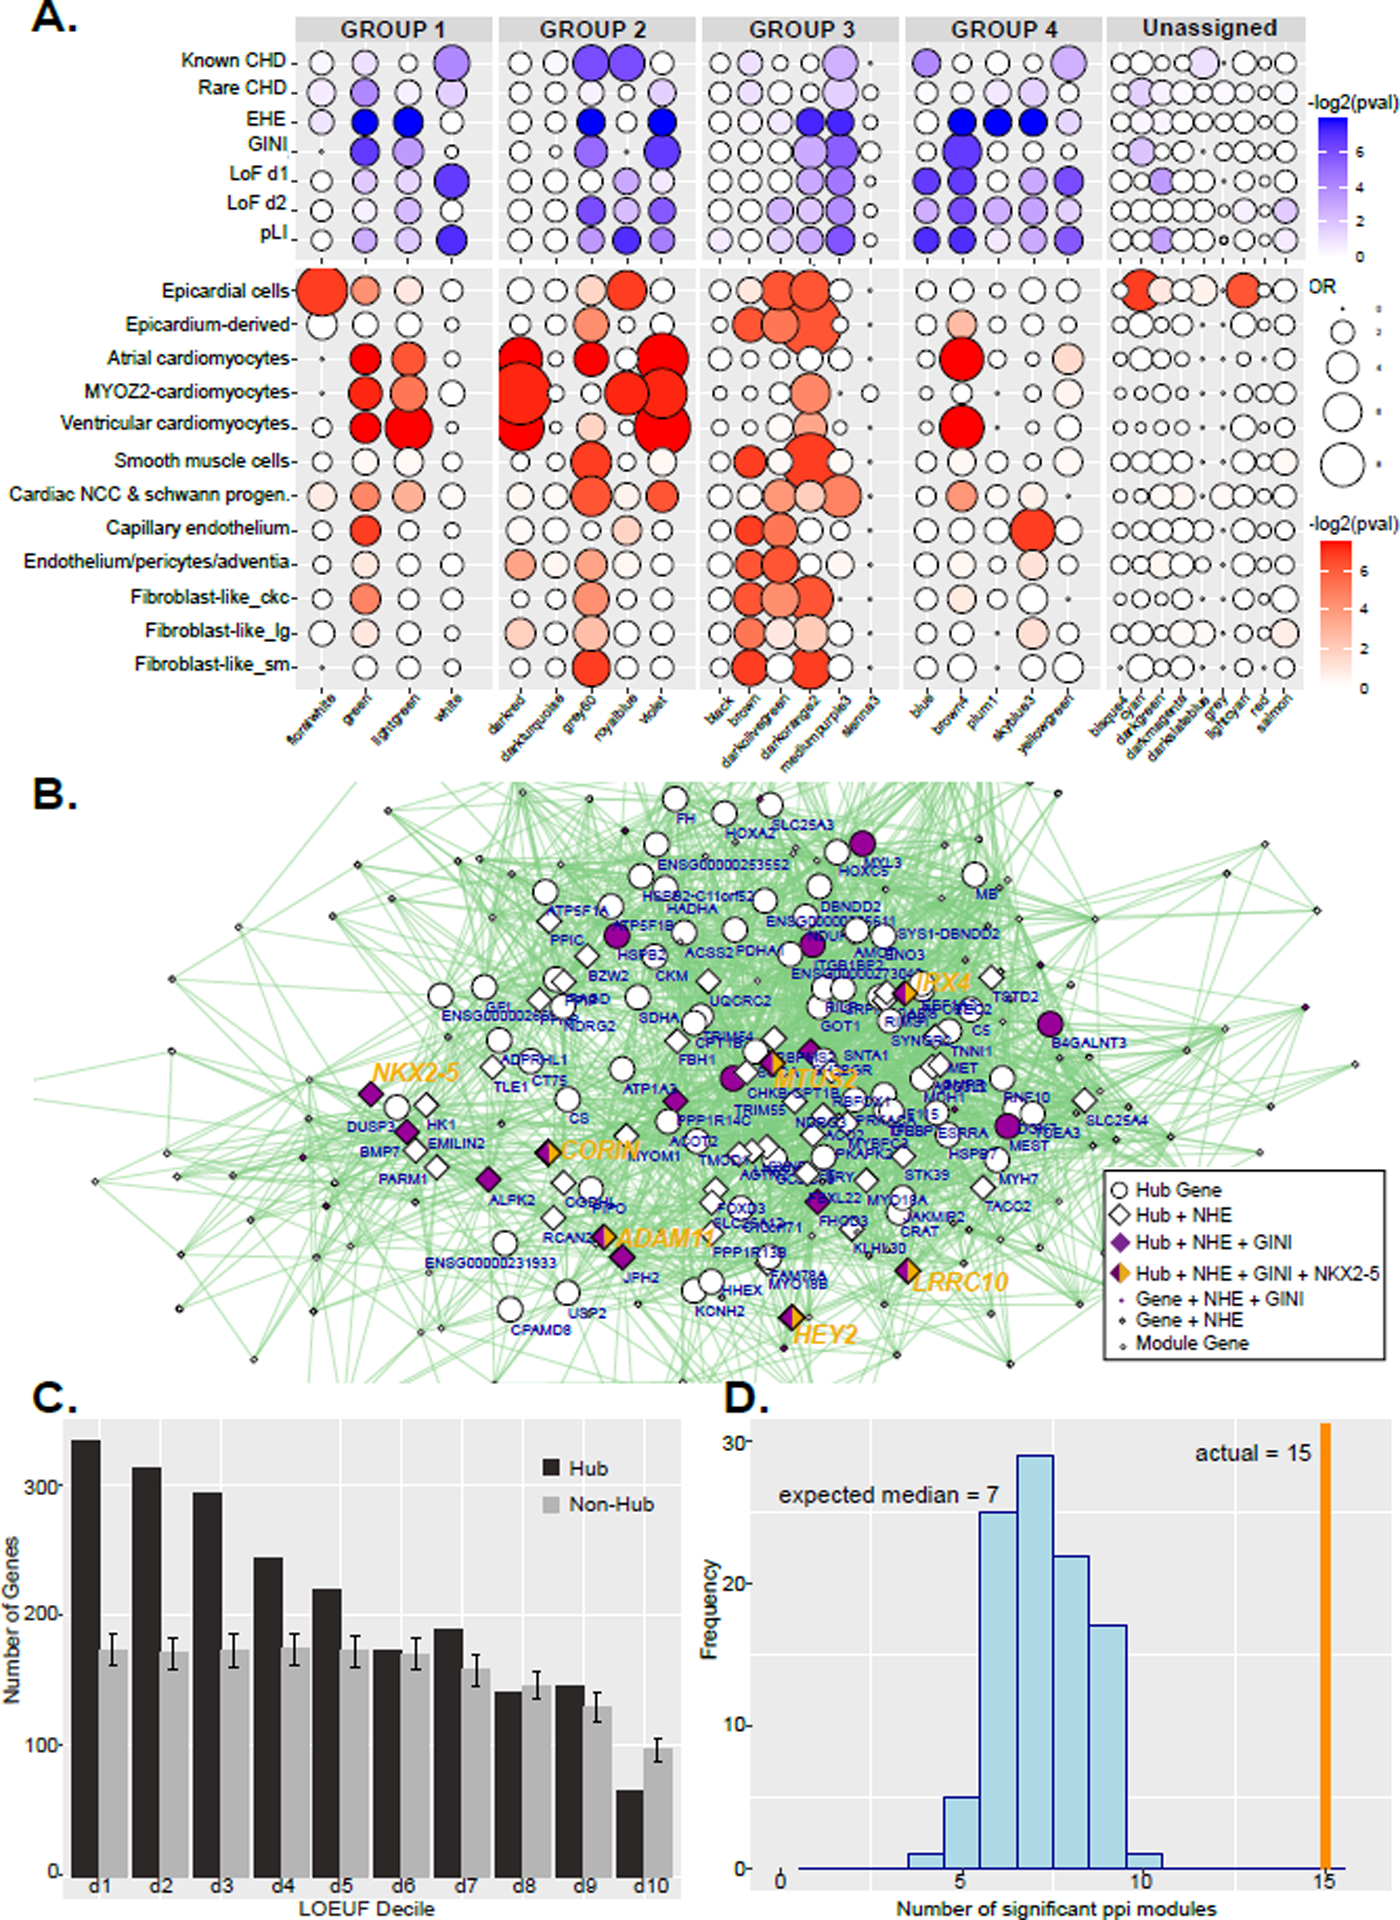
Figure 8. WGCNA significance tests and network for violet module.

A. Dot plots of gene enrichment within the WGCNA modules. The lists of genes used are curated from multiple sources, while EHE and GINI are from this paper. The groups correspond to Figure 5. B. Network of multidimensional scaling coordinates and pairwise correlation scores for the violet module in Group 4 in D which is enlarged to show detail. All genes with correlation value greater than 0.88 with any other gene are plotted. Size of shape indicates highly connected hub genes. Diamonds represent genes assigned EHEs. Purple filled shapes indicate heart specific gene expression (GINI >= 0.5). Hub genes are labeled with gene symbol. Genes directly positively regulated by NKX2–5 binding are indicated with yellow. Several hub genes that have all these criteria are listed in larger yellow text. C. Histogram of LOEUF deciles of hub genes or randomly selected non-hub genes from all modules in the WGCNA network. Deciles range from decile 1 (d1) which represent the most constrained genes to d10, genes that are the most tolerant to putative loss-of-function (pLoF) variation. Error bars indicate standard deviation of 1000 random permutations of non-hub genes. D. Histogram of the number of gene-scrambled modules that have ppi enrichment at a Bonferroni adjusted p-value of <0.05. The vertical orange line marks the 15 modules that have significant ppi in the actual WGCNA network.
