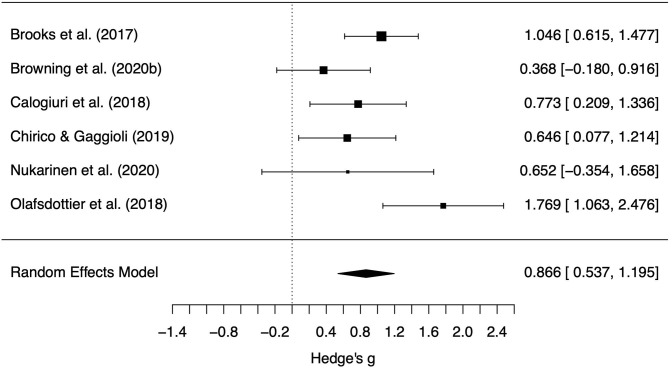
Figure 3.
Forest plot of standardized mean difference positive affect change scores between the actual and simulated natural settings. Points indicate the estimated effect for each study with variance estimates indicated by the size of the point and width of the error bars. Scores above 0 indicate greater increase in positive affect in the actual natural setting.

