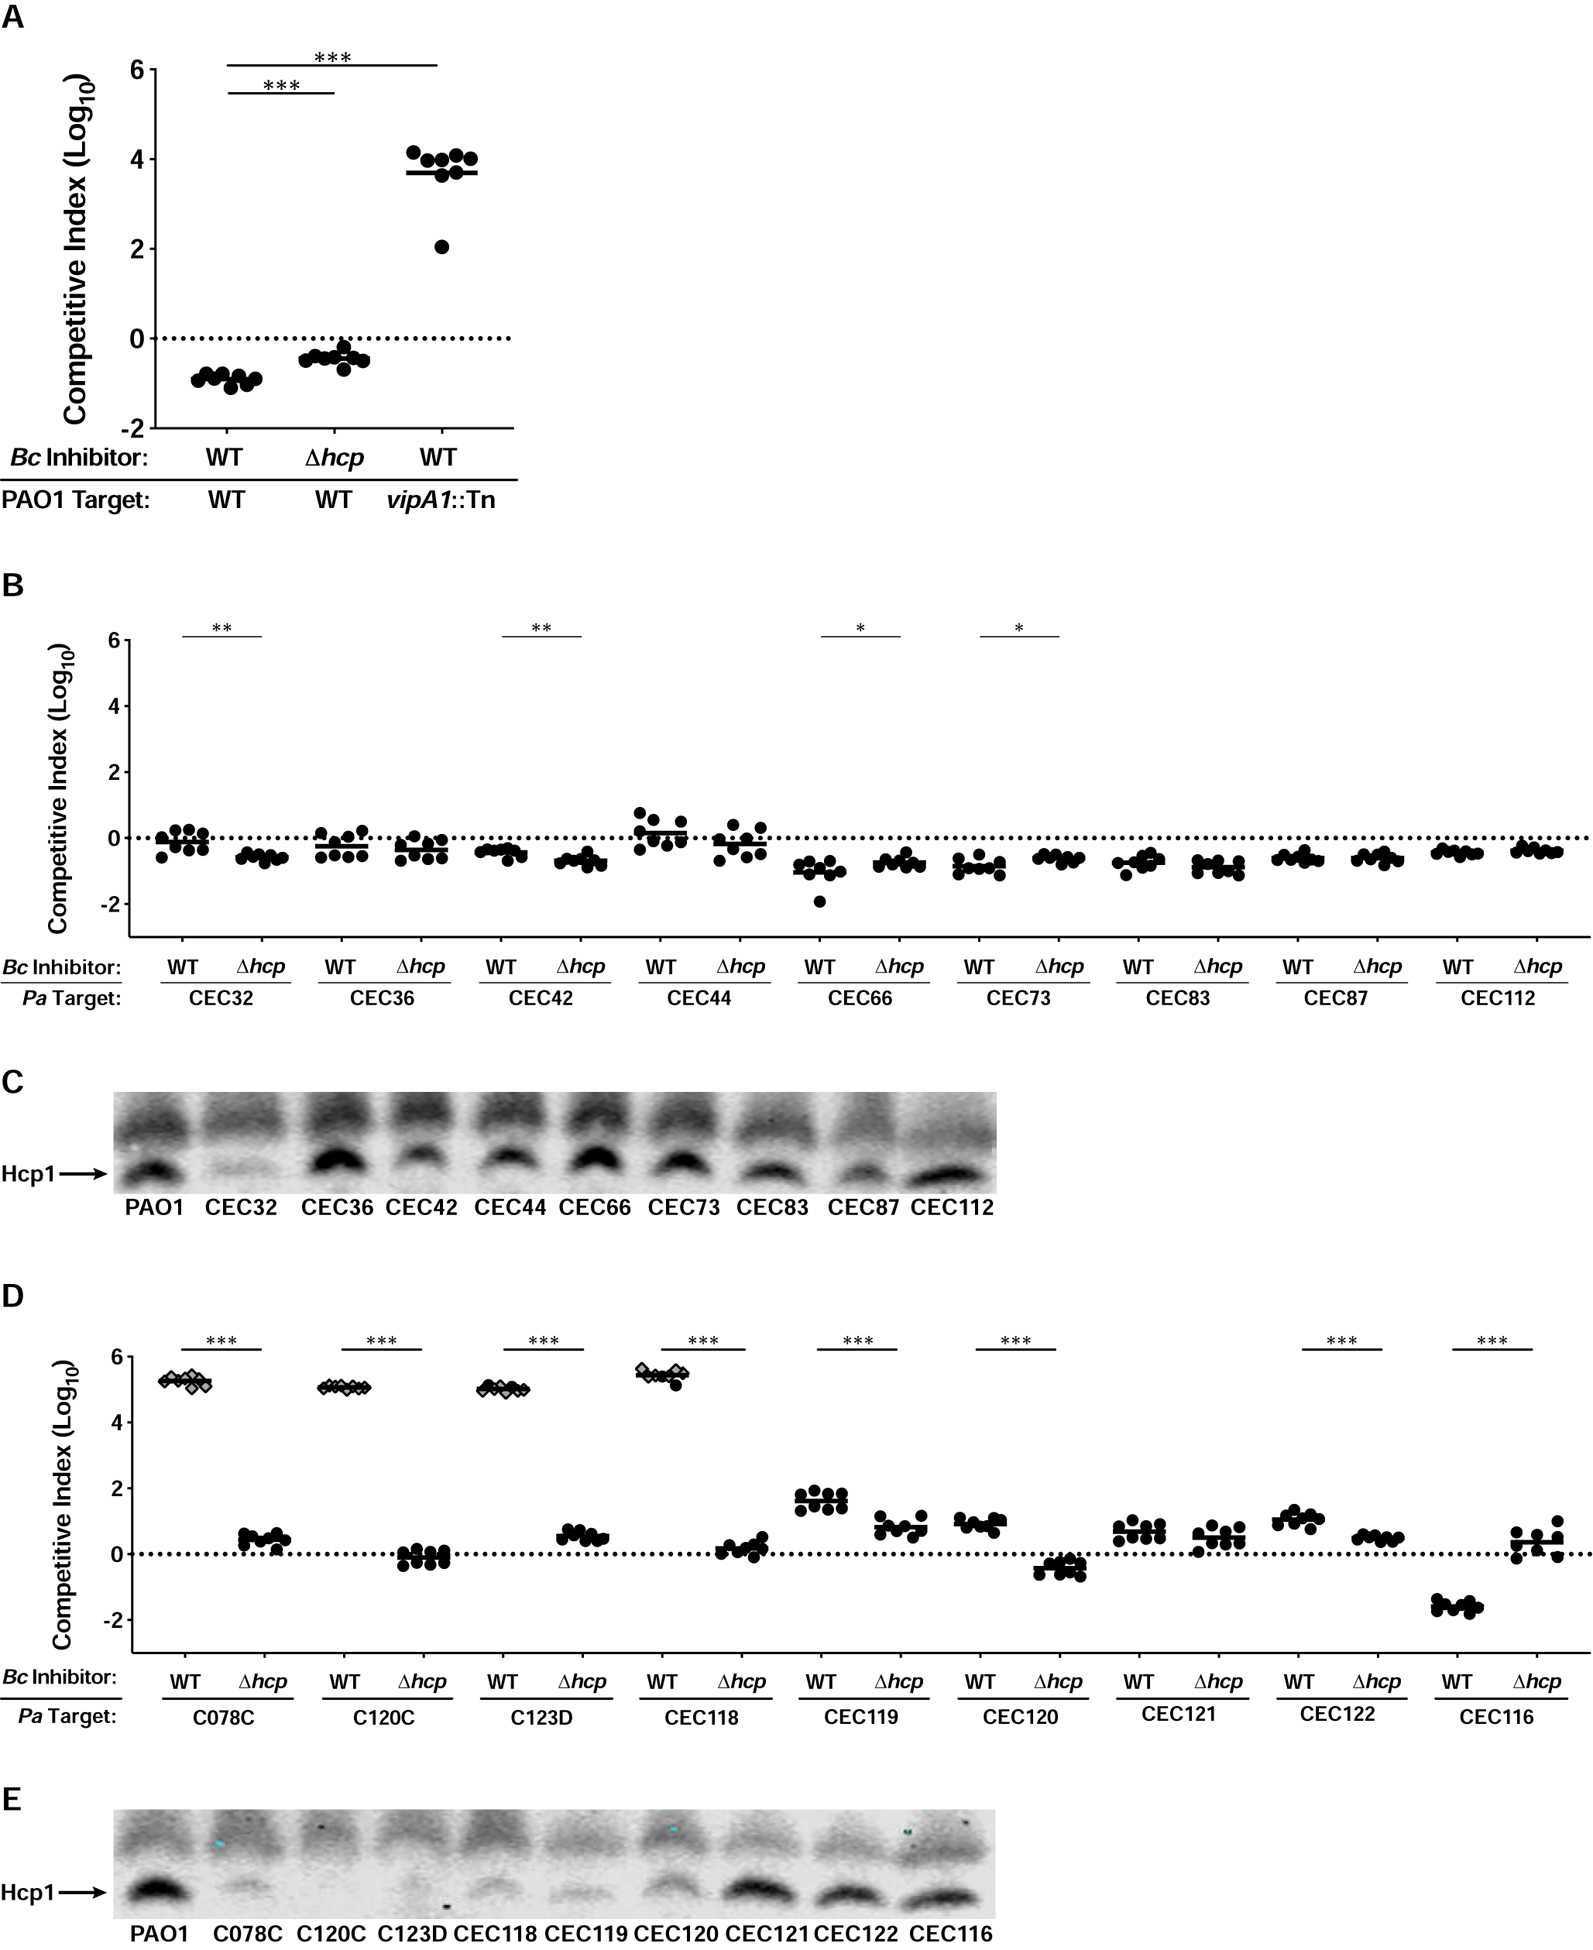
Figure 3. Susceptibility of P. aeruginosa CF isolates to the BcAU1054 T6SS correlates with patient age.

(A) Competition experiments between WT and Δhcp BcAU1054 inhibitor strains and WT and vipA1::Tn PAO1 target strains. (B) Competition experiments between WT and Δhcp BcAU1054 inhibitor strains and P. aeruginosa infant/child CF isolate targets. (C) Immunoblot for Hcp1 production by PAO1 and P. aeruginosa infant/child CF isolates. (D) Competition experiments between WT and Δhcp BcAU1054 inhibitor strains and P. aeruginosa teenage/adult CF isolate targets. (E) Immunoblot for Hcp1 production by PAO1 and P. aeruginosa teenage/adult CF isolates. For (A, B, and D), circles/diamonds represent individual cocultures from two biological replicates, each with four technical replicates. Grey-filled diamonds represent competitions from which no target cells were recovered. Solid horizontal lines represent mean log10 C.I. values. Dotted horizontal lines (log10 C.I. = 0) indicate no competitive advantage for either strain. *P<0.05, **P<0.005, ***P<0.0005, Mann-Whitney test. For (C and E), non-specific band above Hcp1 serves as loading control. Blots are representative of at least two experiments per strain.
