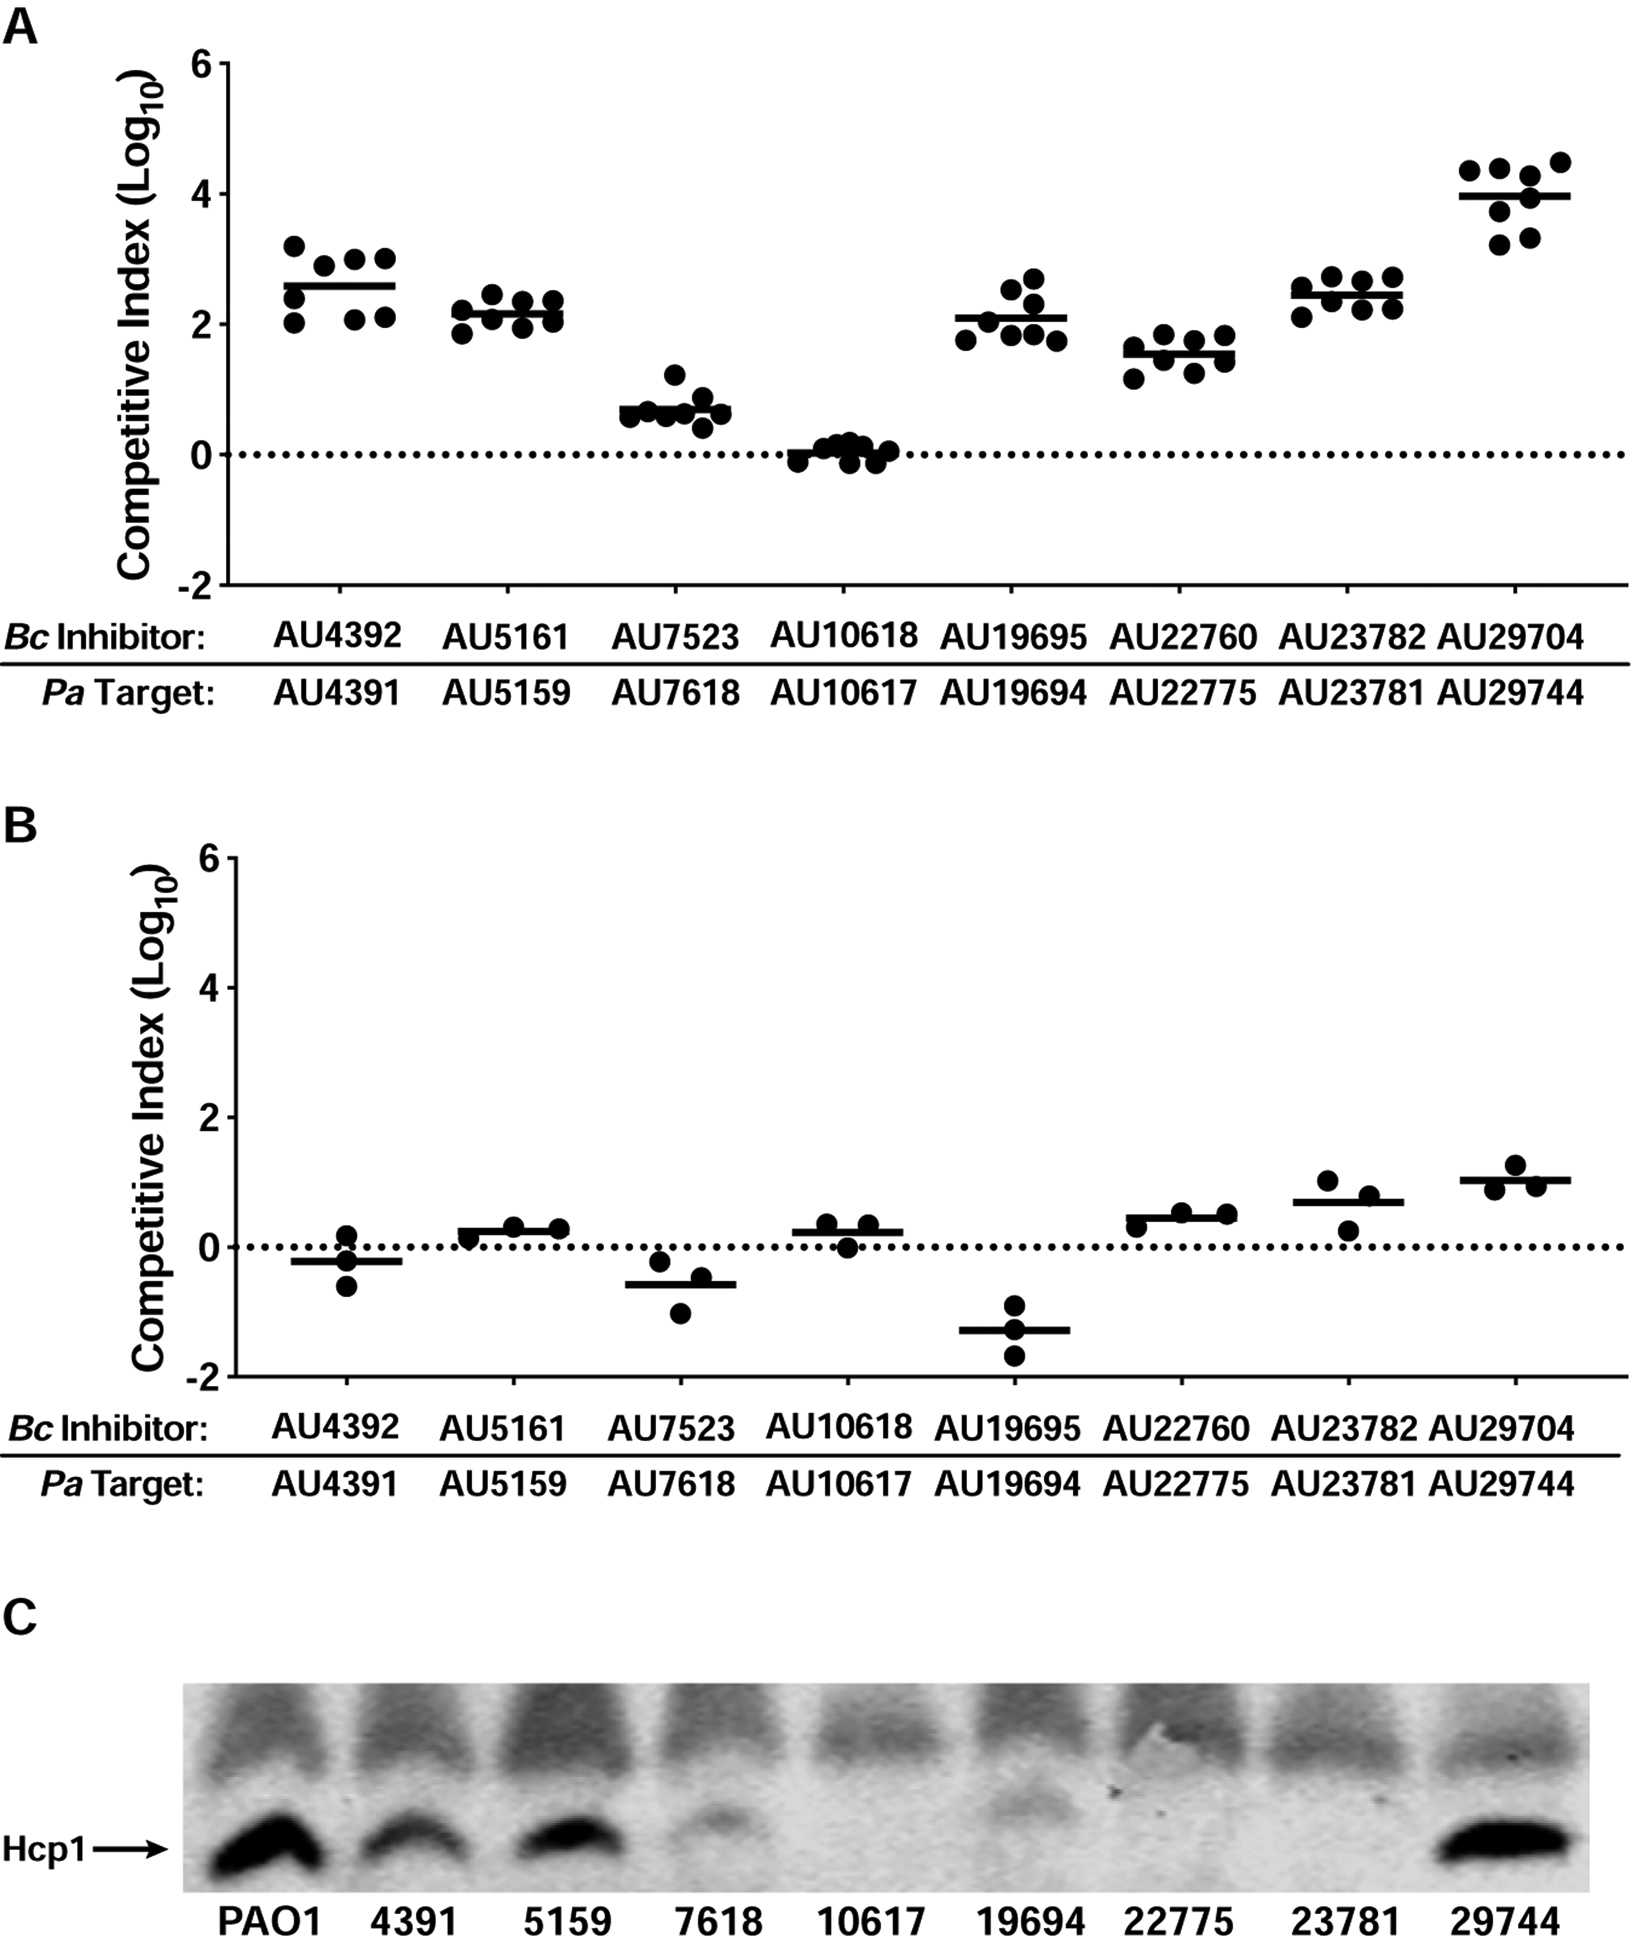
Figure 6. B. cenocepacia isolates from CF patients with concurrent P. aeruginosa infections outcompete their paired P. aeruginosa isolates under T6SS-permissive conditions.

(A and B) Competition experiments between B. cenocepacia-P. aeruginosa co-infection isolate pairs on agar (A) and in shaking liquid culture (B). In (A), circles represent individual cocultures from two biological replicates, each with four technical replicates. In (B), circles represent individual cocultures from three biological replicates. Solid horizontal lines represent mean log10 C.I. values. Dotted horizontal lines (log10 C.I. = 0) indicate no competitive advantage for either strain. (C) Immunoblot for Hcp1 production by P. aeruginosa co-infection isolates, and PAO1 for comparison. Non-specific band above Hcp1 serves as loading control. The blot is representative of at least two experiments per strain.
