FIGURE 3.
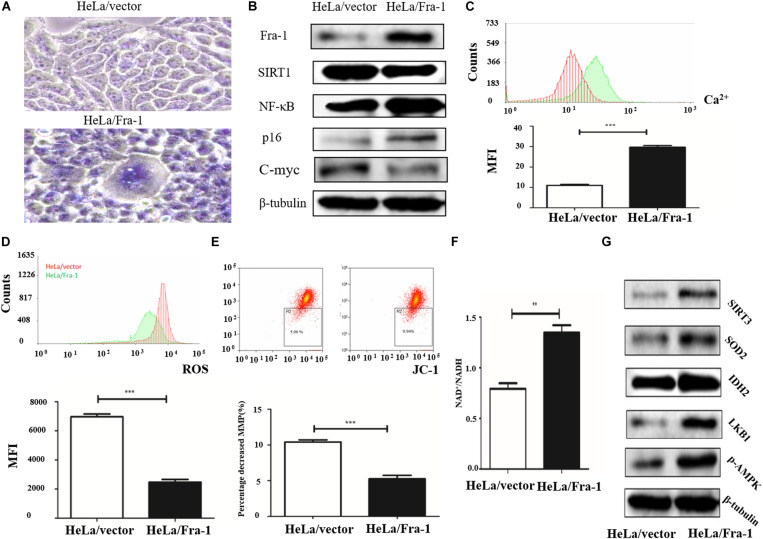
Fra-1 promoted cell senescence and restored mitochondrial disorder in cervical cancer cells. (A) β-Galactosidase assay for cell senescence in HeLa/vector and HeLa/Fra-1 cells. (B) Western blot analysis of Fra-1, SIRT1, NF-κB, p16, and c-Myc protein expression in HeLa/vector and HeLa/Fra-1 cells. (C) Flow cytometric analysis of intracellular Ca2+ concentration. Red color represents HeLa/vector group and green color represents HeLa/Fra-1 group. (D) Flow cytometric analysis of intracellular reactive oxygen species (ROS) concentration. Red color represents HeLa/vector group and green color represents HeLa/Fra-1 group. (E) Flow cytometric analysis of mitochondrial membrane potential (Δψm) in HeLa/vector and HeLa/Fra-1 cells. (F) NAD+/NADH ratio in HeLa/vector and HeLa/Fra-1 cells. (G) Western blot analysis of sirtuin 3 (SIRT3), SOD2, IDH2, LKB1, and p-AMPK expression in HeLa/vector and HeLa/Fra-1 cells. **P < 0.01; ***P < 0.001, n = 3.

