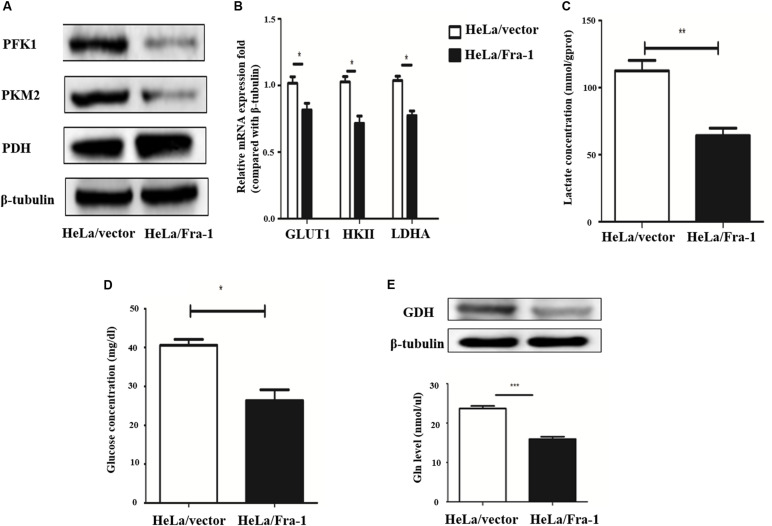
FIGURE 4.
Fra-1 suppressed metabolic reprogramming in cervical cells. (A) Western blot analysis of the expression of key glycolysis enzymes PFK1, PKM2, and PDH in HeLa/vector and HeLa/Fra-1 cells. (B) Real-time polymerase chain reaction (PCR) analysis of the expression of glycolysis enzymes GLUT1, HK II, and LDHA in HeLa/vector and HeLa/Fra-1 cells. (C) Lactate concentration in HeLa/vector and HeLa/Fra-1 cells. (D) Glucose concentration in HeLa/vector and HeLa/Fra-1 cells. (E) Glutamine dehydrogenase (GDH) protein level and glutamine concentration in HeLa/Fra-1 and HeLa/vector cells. *P < 0.05; **P < 0.01; ***P < 0.001, n = 3.

