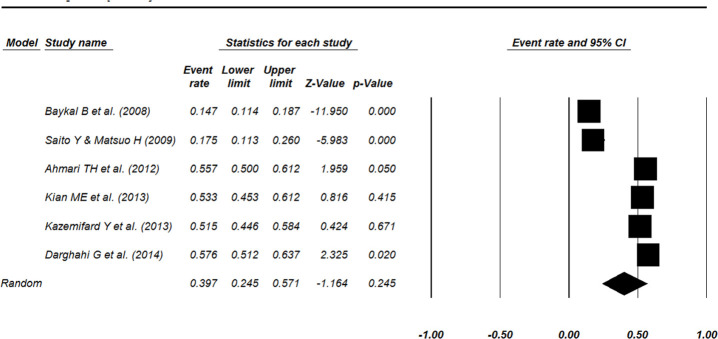
Fig. 2:
Forest plot showing the weighted event rate for women’s opinion concerning gestational surrogacy. Studies are represented as squares and the area of the square represents the weight given to the study in meta-analysis by CMA software. The overall event rate was calculated by a random-effects model. The diamond represents the overall estimated event rate and its 95% CI

