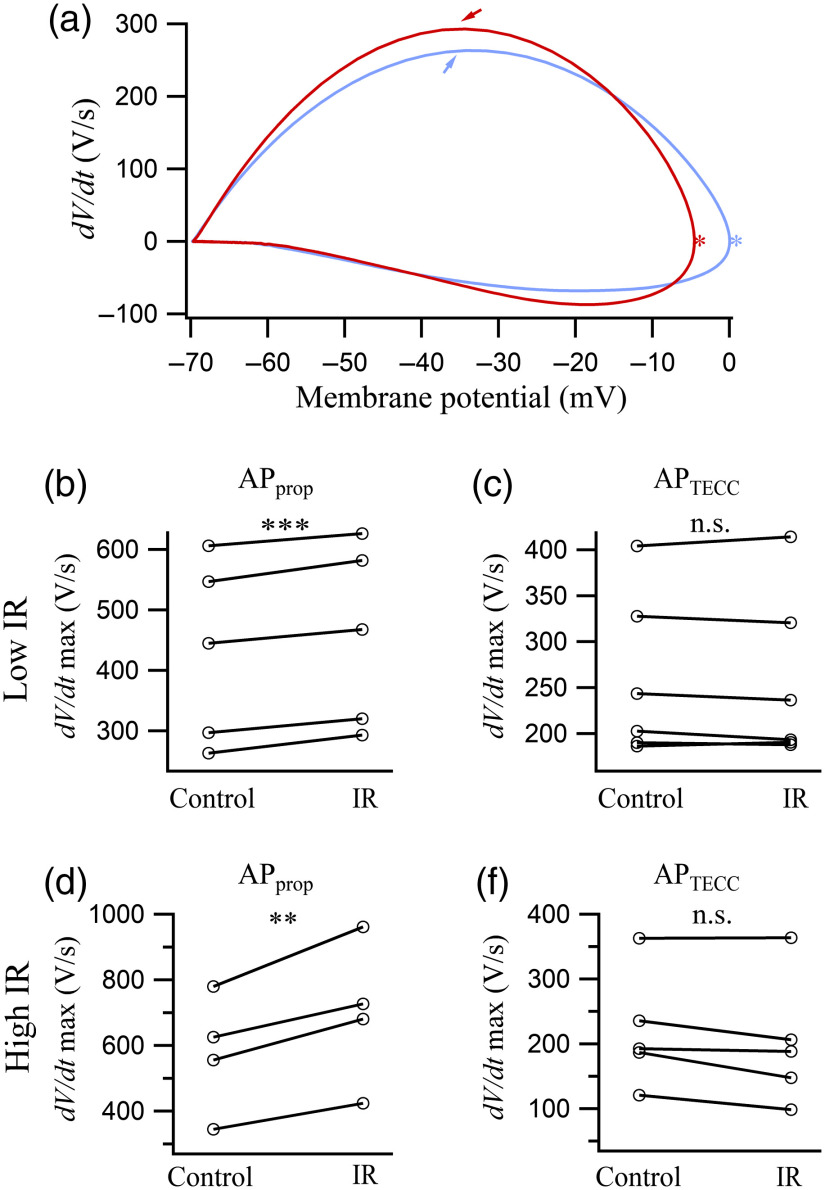
Fig. 3.
IR light pulses increased the maximum of of the . (a) Phase plot of a pair of with (red) and without (blue) IR light. Arrows indicate the maximum of . Stars indicate the amplitude of the . (b) The maximum of of the under IR light illumination () exhibited a significant increase of () compared to the control values. (c) The maxima of of the under control and IR light illumination conditions () did not differ statistically (). (d) The maxima of of the under 13.1-mW IR light illumination () exhibited an increase of () compared to the control values. (e) The maxima of of the under control and IR light illumination at 13.1-mW conditions () did not differ statistically ().

