Fig. 4.
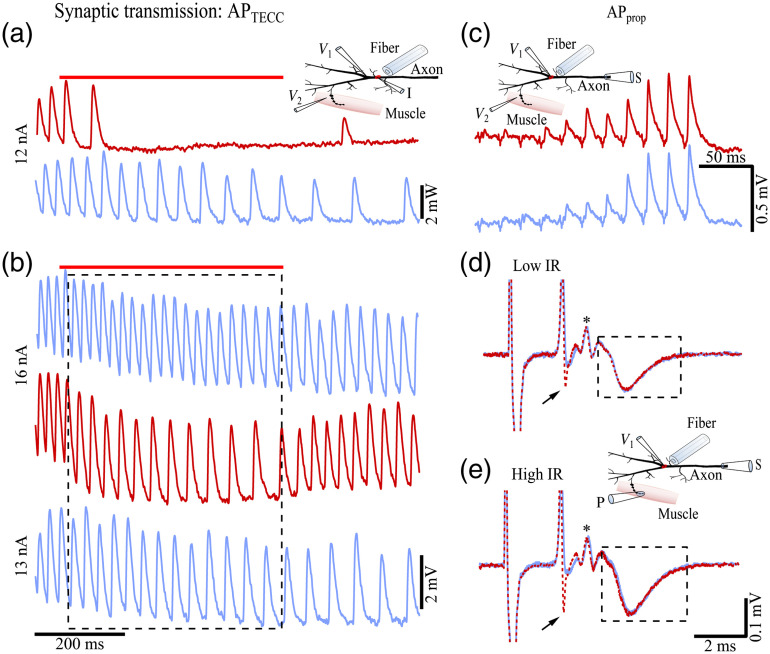
Effects of inhibiting and on synaptic transmission. (a) IPSP trains recorded from a muscle cell ( electrode in the inset) with (red) and without (blue) 7.1-mW power IR light illumination on the axon. The low-frequency firing and the downstream IPSPs, evoked by a 12-nA current step, were blocked during the later period of IR light illumination. (b) IPSP trains at higher frequencies recorded from the same muscle cell as in (a), evoked by 16 (upper and middle traces) and 13 nA (bottom trace) steps. During the IR light irradiation, the amplitude of the individual IPSPs increased while the frequency decreased (middle red trace versus upper blue trace) due to the decreased firing frequency caused by IR light illumination (7.1 mW). The IPSP amplitudes of the middle red trace within the dashed box are comparable to a control trace of comparable frequency (bottom blue trace). Red bars above (a) and (b) indicate the timing of the IR light pulses. (a) and (b) Share the same time calibration. (c) EPSPs ( electrode in the inset) evoked by with (red) and without (blue) 7.1-mW power of IR light illumination on the axon. (d) and (e) Macro-patch recordings ( electrode in the inset) of the end-plate currents, evoked by , with (red) and without (blue) 7.1 mW (d) and 13.1 mW (e) power of IR light illumination at the main branching point of the axon. Traces are averages of 60 trials. Arrows indicate the coupling potentials between and P electrodes. Stars indicate the APs at the presynaptic terminals.

