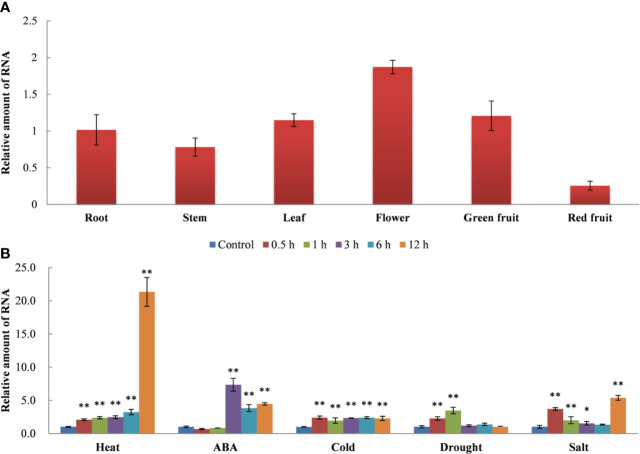
Figure 2.
Tissue-specific expression (A) and stress-response patterns (B) of SlDREBA4. The unstressed expression level (Control) was assigned a value of 1. The error bar on each column represents the standard deviation (SD) of the three biological replicates (Student’s t-test, *P < 0.05, **P < 0.01).

