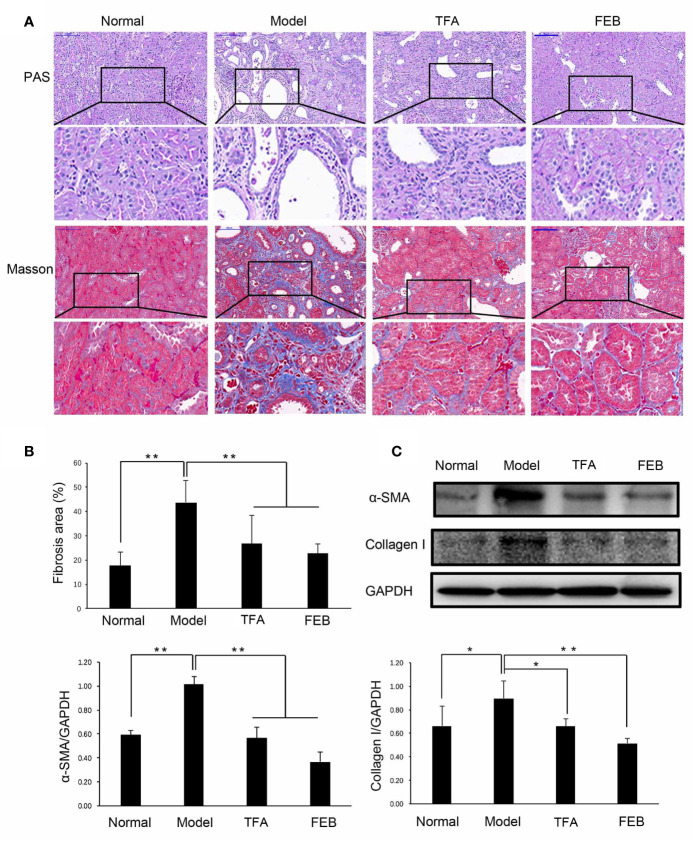
Figure 1.
Effects of TFA and FEB on renal injury. (A) Photomicrographs of periodic acid-Schiff (PAS) staining and Masson’s trichrome staining in the Normal, Model, TFA, and FEB rat groups. Scale bar: 100 μm. (B) Fibrosis area. (C) A WB analysis of α-SMA and collagen I in the kidneys of the Normal, Model, TFA, and FEB rats. The data are expressed as the mean ± SD, (n = 3). * P < 0.05, ** P < 0.01. TFA, total flavones of Abelmoschus manihot; FEB, febuxostat; α-SMA, α-smooth muscle actin; WB, Western blotting; SD, standard deviation.

