FIGURE 3.
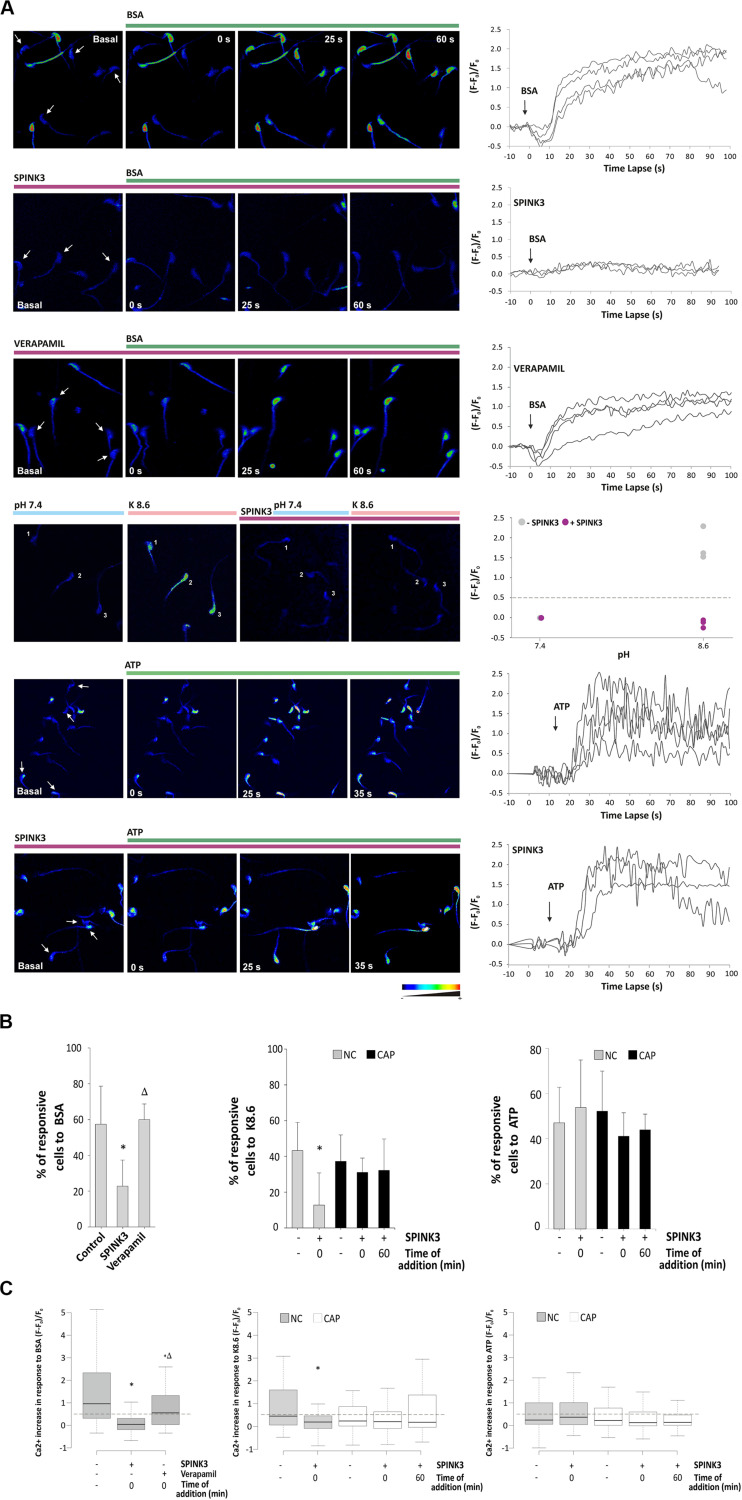
Effect of SPINK3 on [Ca2+]i during sperm capacitation. Non-capacitated sperm loaded with Fluo-3 AM were exposed to 13 μM SPINK3 or 100 μM verapamil for 15 min. After washing with fresh media, cells were smeared on laminin-coated slides and basal calcium signal (F0) was monitored before any stimulus was applied. Single-cell fluorescence (F) was monitored and recorded. (A) Representative pseudocolor images of calcium concentration in the head of control cells. Different stimuli (BSA, K8.6 medium or ATP) were added to test an intracellular calcium increase (green bar). Graph on right panels show representative images for calcium fluctuations, obtained as the fluorescence change (F - F0)/F0. (B) Percentages of sperm that increased at least 1.5-fold the calcium intensity compared to the basal signal after stimulus. Capacitated (CAP) or non-capacitated (NC) sperm were treated as indicated (left panel, BSA: n = 12, 822 cells, *p < 0.05 with respect to control, Δp < 0.05 with respect to SPINK3; middle panel K8.6: n = 3, 430 cells, *p < 0.05 with respect to control; right panel: ATP: n = 3, 410 cells, *p < 0.05 with respect to control). (C) Fluorescence intensity after 60 s of stimulus expressed as (F - F0)/F0, where F is the fluorescence intensity at time t and F0 is the mean basal fluorescence. The dotted line indicates the threshold lay out from which a significant increase in calcium uptake in the sperm head (positive response) was considered. Outliers were excluded from the graphical representation. Capacitated or non-capacitated sperm were treated as indicated (left panel, BSA: n = 12, 822 cells, *p < 0.05 with respect to control, Δp < 0.05 with respect to SPINK3; middle panel K8.6: n = 3, 430 cells, *p < 0.05 with respect to control; right panel: ATP: n = 3, 410 cells, *p < 0.05 with respect to control).

