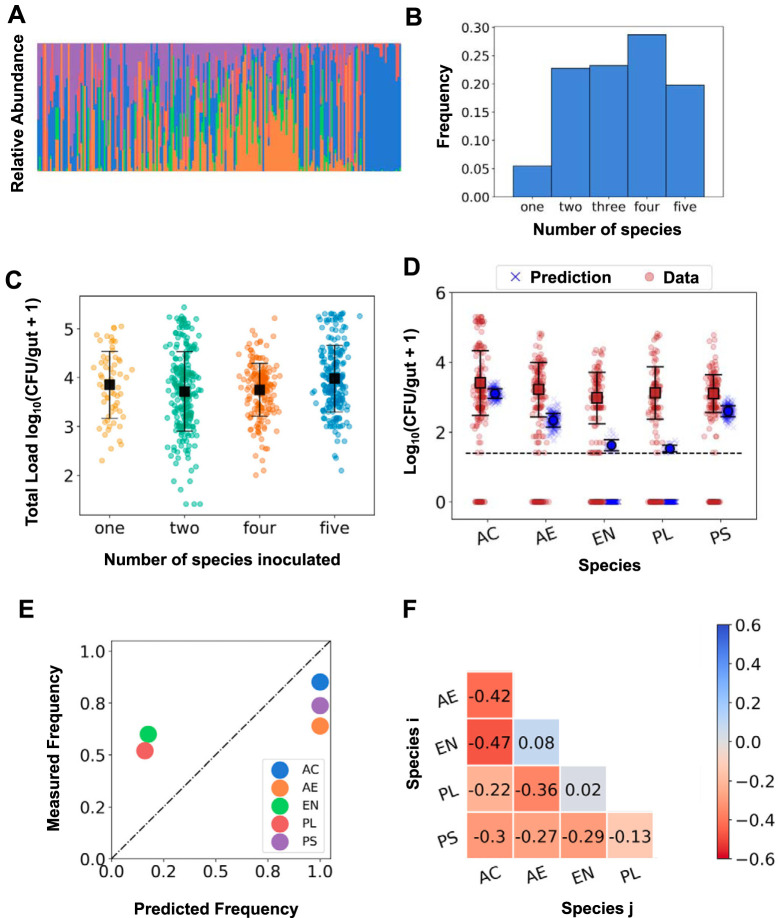
FIG 4.
Communities are more diverse and abundant in five-species experiments than would be predicted solely based on two-species pairwise interactions. (A) Stacked bar plot of the relative abundances of the five bacterial species when all five were coinoculated. Each bar is from a single dissected fish. The bars are ordered by total bacterial load. (B) Histogram of the total number of bacterial species present in the gut when all five species were coinoculated. (C) The total bacterial load as a function of the number of inoculated species. Each circular data point is a CFU value from an individual fish (N = 63, 232, 187, and 202, from left to right), with the mean and standard deviation indicated by the square marker and error bars. (D) The predicted (blue Xs) and measured (brown circles) abundances of each bacterial species in the zebrafish gut when all five species are coinoculated. Predictions are based on an interaction model that is linear in log abundance using the pairwise coefficients, as described in the text. Solid square markers indicate the mean and standard deviation of the distributions excluding null counts. The dotted line indicates the experimental detection limit of 25 cells. The experimental data are from N = 202 fish in total, and the predicted distributions arise from 250 samples of the distribution of interaction coefficients. (E) The observed frequency of occurrence in the gut from the five-species coinoculation experiment versus the predicted frequencies for each of the five species. (F) The Pearson correlation coefficients calculated from the relative abundances of pairs of species when all five species were coinoculated. AC, Acinetobacter calcoaceticus; AE, Aeromonas sp. strain ZOR0001; EN, Enterobacter sp. strain ZOR0014; PL, Plesiomonas sp. strain ZOR0011; PS, Pseudomonas mendocina.

