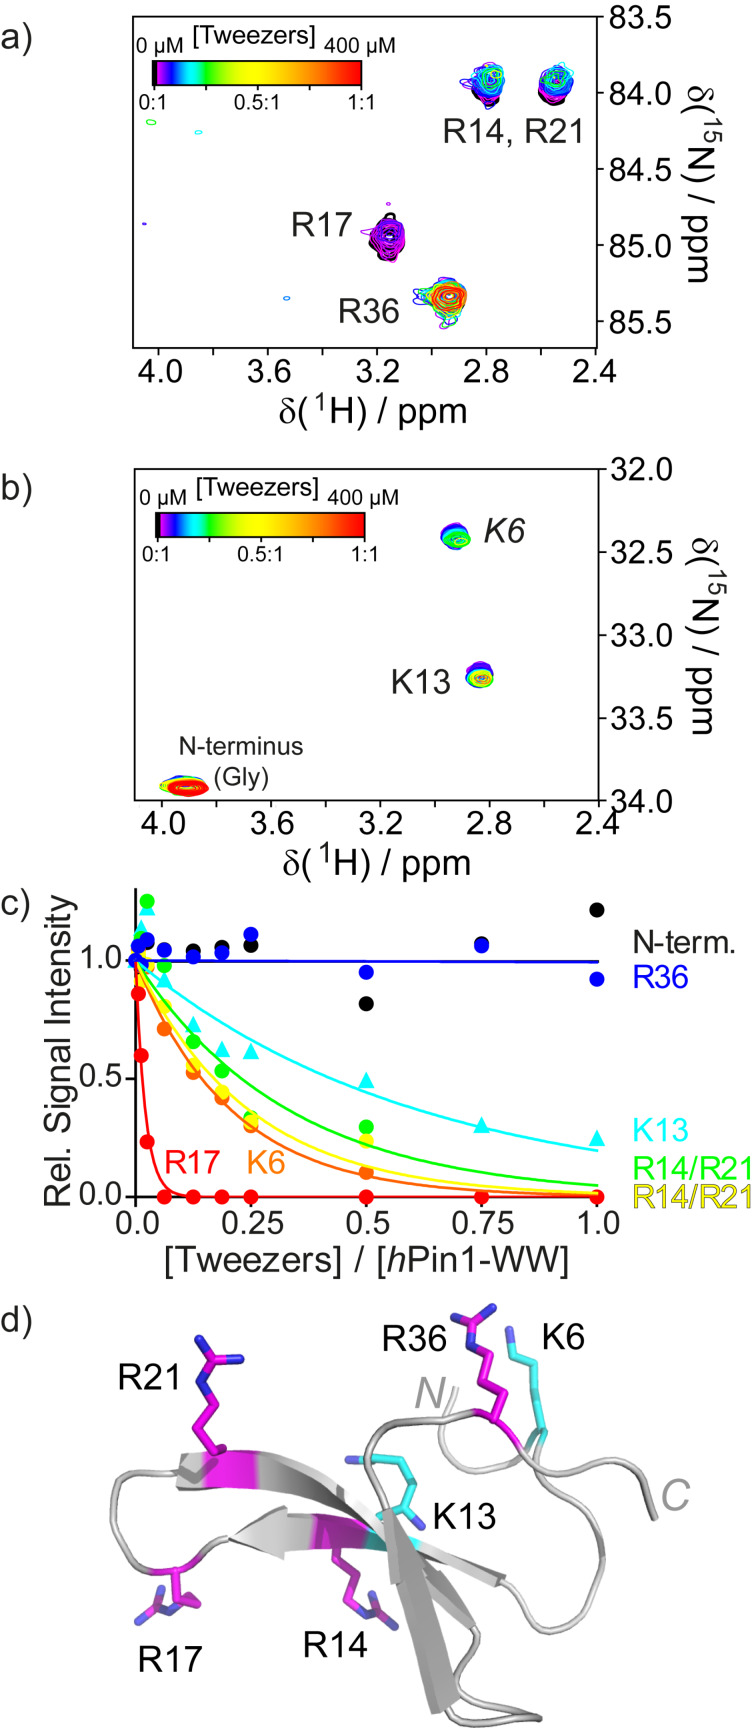
Figure 6.
H2(C)N spectra specific for arginine (a) and lysine (b) residues of the hPin1-WW domain at different tweezers concentrations (color-coded). The signals for R14 and R21 are both split and overlap. Upon tweezer binding, line broadening and thus reduced signal intensities are observed. (c) Plotting the relative signal intensities for each signal as a function of tweezers concentration (given in equivalents) reveals a distinct binding order. R17 is the preferred binding site, while R36 and the N-terminus are not bound at all. (d) Structure of the hPin1-WW domain with lysines highlighted in cyan and arginines highlighted in magenta. Reprinted (reproduced) with permission from [80], copyright (2017) Wiley-VCH Verlag GmbH & Co. KGaA.

