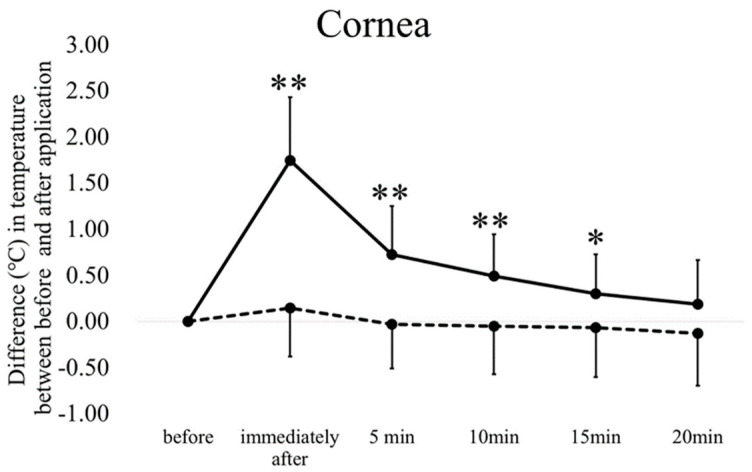
Figure 4.
The time course of changes in the corneal temperature after the application of warmed and room temperature devices for 5 min. The solid line indicates the changes in temperature with the warmed device; the dashed line indicates the changes with the room temperature control device. The error bars represent the standard deviations of the subjects. * p < 0.05 (Dunnett’s test), ** p < 0.01 vs. before device application.

