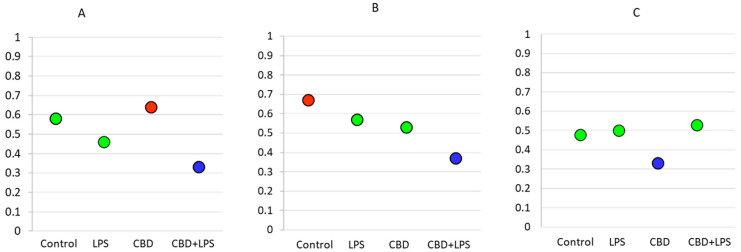
Figure 7.
Spearman’s correlation index between PASI and relevant parameters. Blue circle—low correlation (Spearman correlation below 0.4); Green circle—medium correlation (Spearman correlation index from 0.4 to 0.6); Red circle—high correlation (Spearman correlation index from 0.6 to 0.8); (A) Percentage of NETotic cells and PASI; (B) MPO level and PASI; (C) cfDNA and PASI.

