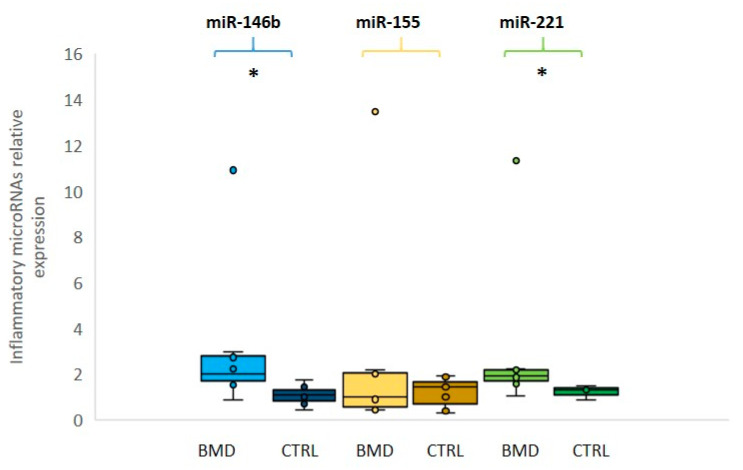
Figure 2.
Relative expression of inflammatory microRNAs in BMD patients. Box plots showing the levels of miR-146b (light blue for patients and dark blue for controls), miR-155 (yellow for patients and dark yellow for controls) and miR-221 (green for patients and dark green for controls) (by qRT-PCR analyses in the serum of eight BMD patients and in six healthy controls). Data were significant, p-values (p ≤ 0.05), for miR-221 and miR-146b between patients and controls. Single points show the individual inflammatory miRNAs levels, the box represents the quartiles (first and third) divided into two parts by the median (second quartile), and the maximum and minimum values are also indicated BMD: Becker muscular dystrophy; CTRL: controls; * indicates significance (p ≤ 0.05).

