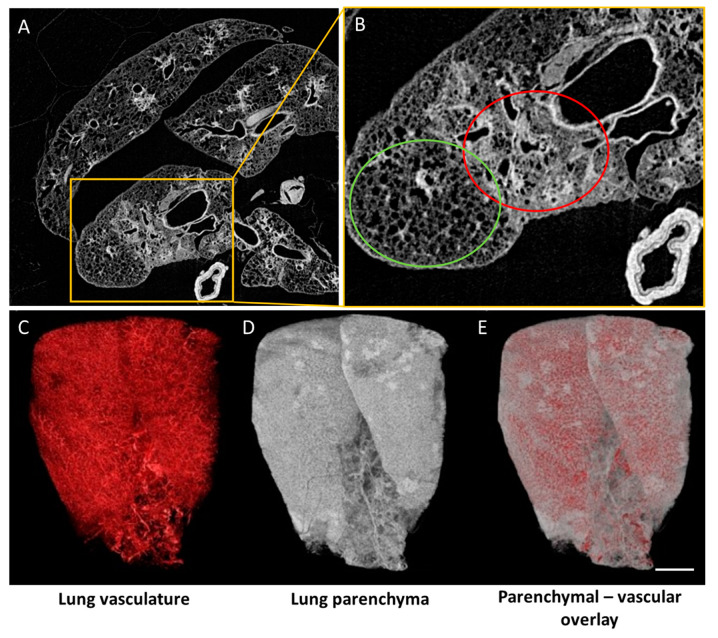
Figure 4.
High resolution ex vivo µCT of isolated rodent lung. (A) Reconstructed µCT of whole mouse lung, visualizing spatial differences in lung pathology; (B) enlargement of the yellow box in A, zooming in on spatial differences in areas with localized lung inflammation (red circle) and non-pathological regions (green circle); (C–E) Ex vivo µCT of rat lung with barium-based vascular perfusion. Vascular network rendered with maximum intensity projection (MIP) (C); lung parenchyma visualized using minimum intensity projection (MinIP) (D); an overlay of parenchymal and vascular tissue (E). Scale bar 5 mm. Video is available as Supplementary Video S2.

