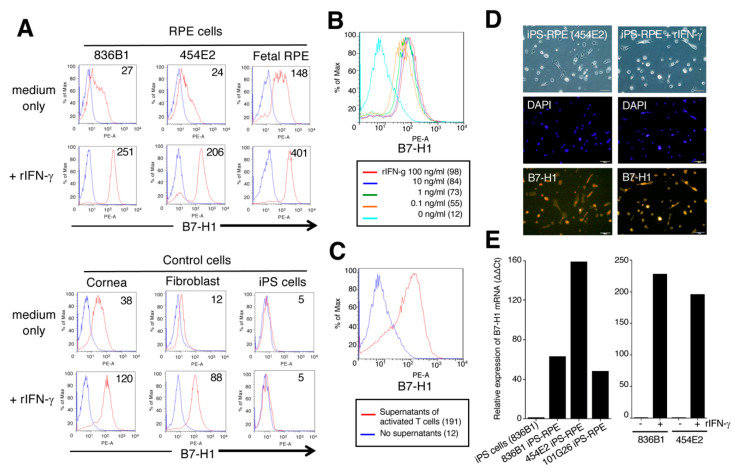
Figure 3.
Expression of B7-H1 molecules on human iPS-RPE cells. The expression of B7-H1 costimulatory molecules on established iPS-RPE cells was assessed by FACS (A–C), IHC (D), and qRT-PCR (E). (A) iPS-RPE cells, 836B1 and 454E2, and primary fetal RPE cells as a control; lower histograms are cells with recombinant IFN-γ. In FACS analysis, human corneal endothelial cells (Cornea) and fibroblast and control human iPS cells (454E2 line) were also prepared. Blue histogram: data for isotype control. The number in the histogram indicates mean fluorescence intensity (MFI). (B) Dose-response assays with recombinant IFN-γ used 0, 0.1, 1.0, 10, and 100 ng/mL. The numbers in parentheses indicate MFI. (C) We also prepared iPS-RPE cells exposed to supernatants collected from activated T cells from a VKH uveitis patient (red histogram). Blue histogram: no supernatants (control). The numbers in parentheses indicates MFI. (D) For IHC, we also prepared 454E2 iPS-RPE cells with or without recombinant IFN-γ. The expression of B7-H1 is shown in red, and middle pictures show cell nuclei counterstained with DAPI. Scale bars, 100 μm. (E) The expression level of B7-H1 mRNA in iPS-RPE cells, 836B1, 454E2, 101G26, and control iPS cells (836B1) is shown. The right panel indicates iPS-RPE cells (836B1, 454E2) with or without recombinant IFN-γ. Results indicate the relative expression of B7-H1 (ΔΔCt: control iPS cells = 1).

