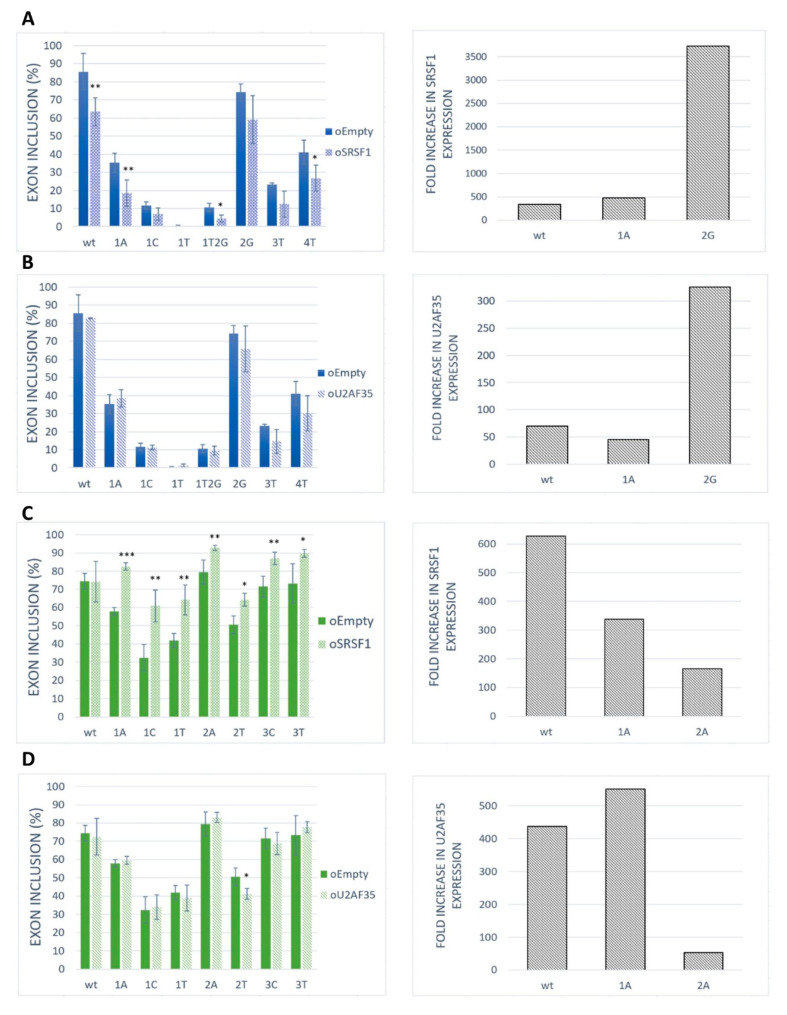
Figure 4.
Effect of SRSF1 and U2AF35 overexpression on exon recognition. HeLa cells were co-transfected with SRSF1 [39] or U2AF35 [40] expression vectors and BRCA2 or VARS2 minigenes. An empty vector was used as a control. Graphs show proportions of exon inclusion upon SRSF1 overexpression (A,C) or U2AF35 overexpression (B,D) (light bars) compared to control (dark bars) in BRCA2 exon 12 (blue) (A,B) or VARS2 exon 17 (green) (C,D). Data are shown as mean exon inclusion percentage ± SD obtained from three independent experiments. Statistically significant differences are shown (* p < 0.05, ** p < 0.01, and *** p < 0.001). On the right, SRSF1 or U2AF35 expression levels are shown as fold-change with respect to control transfections. SRSF1 or U2AF35 expression level upon SRSF1 or U2AF35 overexpression relative to SRSF1 or U2AF35 level from control transfection is shown.

