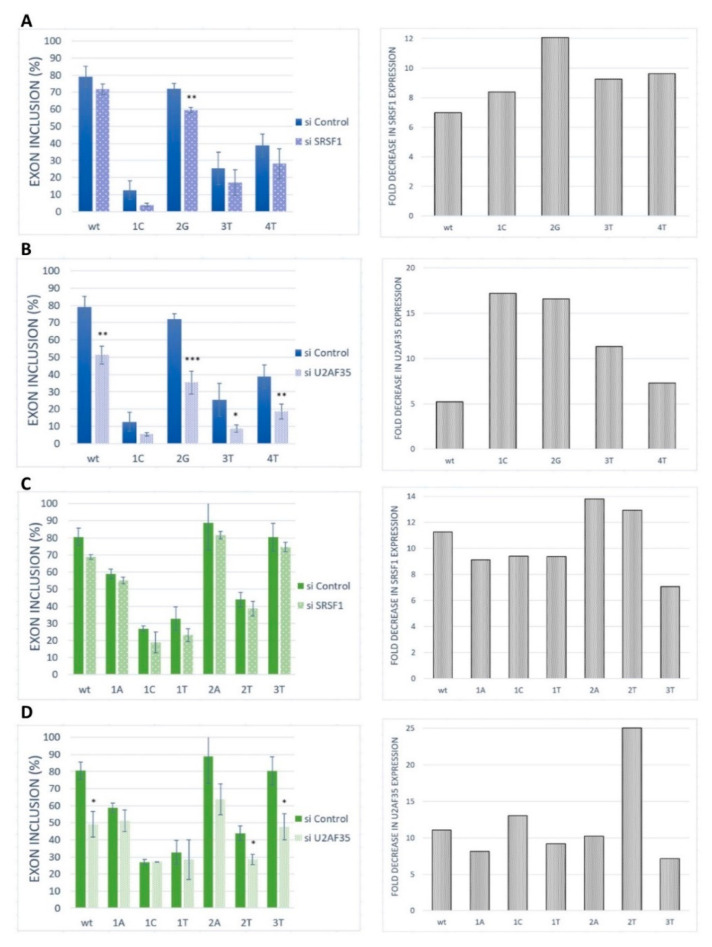
Figure 5.
Effect of SRSF1 and U2AF35 knockdown. HeLa cells were transfected with either a control (si control) or specific siRNA (si SRSF1 or si U2AF35). Graphs demonstrate the proportions of exon inclusion upon SRSF1 (A,C) or U2AF35 (B,D) knockdown in BRCA2 exon 12 (A,B) or VARS2 exon 17 (C,D). Exon inclusion from different minigenes is compared to control transfection (si control). Error bars represent SDs obtained from three independent experiments. Statistically significant differences are shown (* p < 0.05, ** p < 0.01, and *** p < 0.001). On the right, SRSF1 or U2AF35 expression levels are shown as fold-change compared to control transfections (si control). SRSF1 or U2AF35 expression level upon SRSF1 or U2AF35 knockdown (grey bars) relative to SRSF1 or U2AF35 level upon control knockdown is shown.

