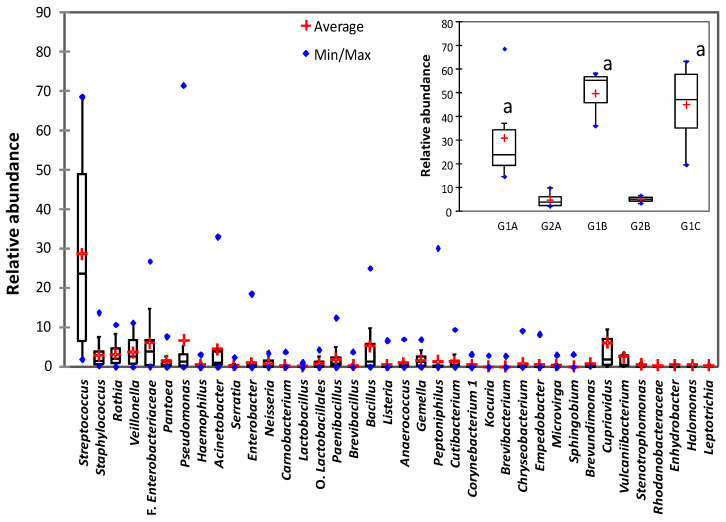
Figure 2.
Box-plot representation of the relative abundances of the 38 main bacterial genera detected in the milk samples. Insert: Box-plot representation of the relative abundances of gen. Streptococcus during the sampling period. Data were grouped by weeks according to relative abundance. Groups with high relative abundance: G1A (weeks 1–4, 6–7), G1B (weeks 14, 16–17), G1C (weeks 21–25, 27–28). Groups with low relative abundance: G2A (weeks 5, 8–10, 12–13), G2B (weeks 18, 20). a statistically significant differences (p < 0.05) with G2A.

