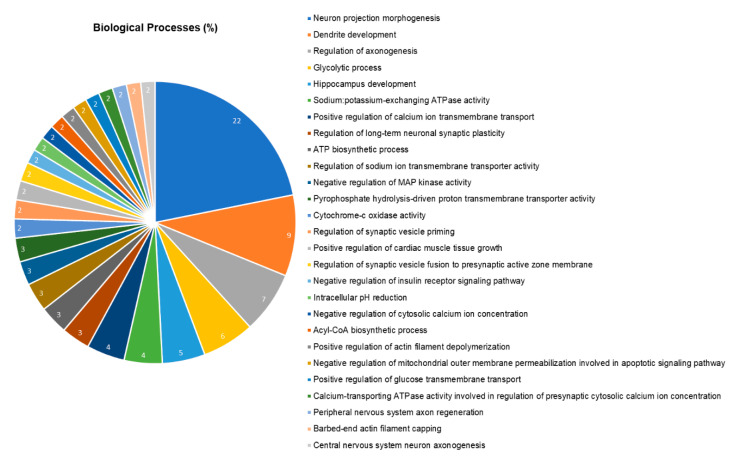
Figure 4.
Functional distribution of proteins identified with differential expression in the hippocampus of rats exposed to lead acetate vs. control group. Protein categories based on Gene Ontology annotations on biologic processes. Significant terms and distribution according to the percentage of the number of genes. Protein access numbers were provided by UNIPROT. Genetic ontology was evaluated according to ClueGO plugin® Cytoscape Software® 3.6.

