Figure 5.
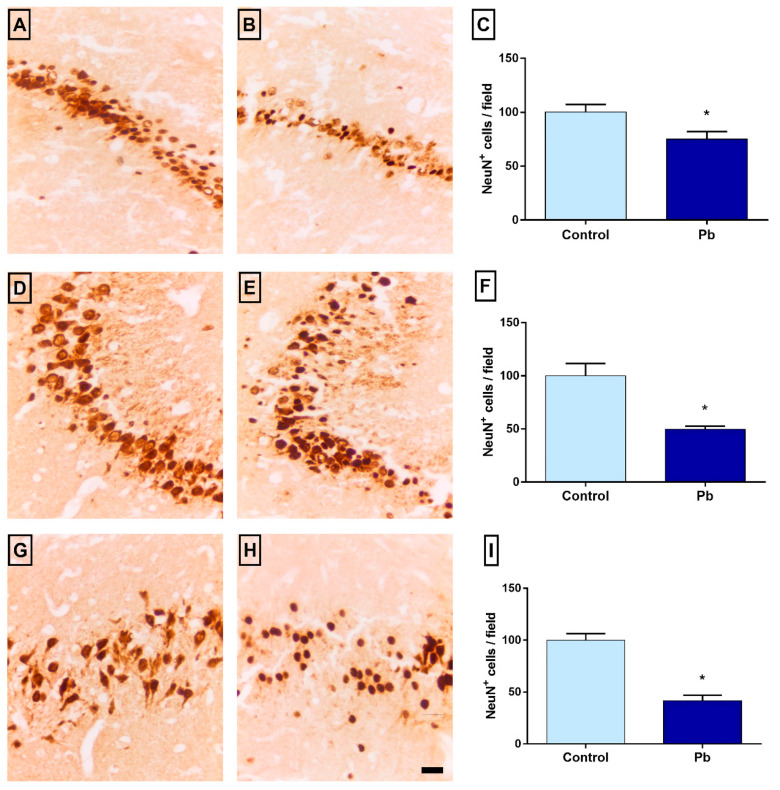
Immunostaining for anti-NeuN in the hippocampus. Representative photomicrographs of CA1, CA3 and hilus in control (A, D and G, respectively) and Pb-exposed group (B, E and H, respectively). Graphs with a quantitative representation of the differences between the number of NeuN+ cells in the respective areas: CA1 (C), CA3 (F) and hilus (I) expressed as mean ± Standard Error of Mean (S.E.M.) of the cell number per field in each region. * p < 0.05 compared to the control group (Student’s t-test). Scale bar: 20 μm.

