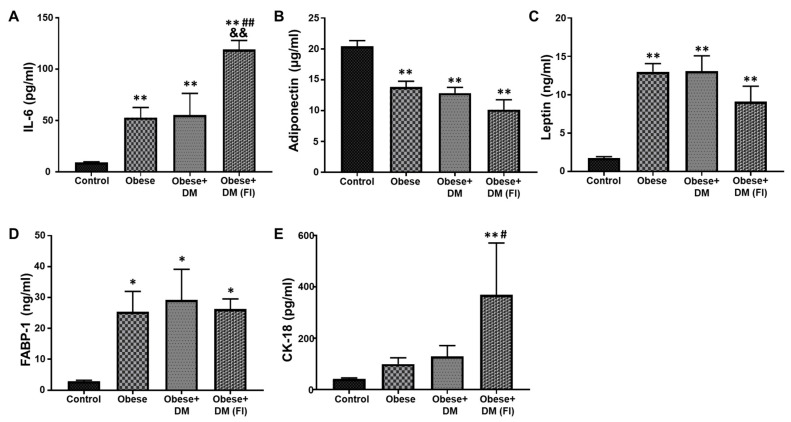
Figure 1.
Quantitative analysis of plasma biomarkers. ELISA assay was performed to determine concentration of key plasma biomarkers in the patient population, which showed progressively altered levels under diseased condition. Plasma concentrations of: (A) IL-6; (B) adiponectin; (C) leptin; (D) FABP-1; and (E) CK-18. Control (n = 20), Obese (n = 20), Obese + DM (n = 12) and Obese + DM(FI) (n = 10). Values represent means ± SEM. * p < 0.05, ** p < 0.01 vs. Control; # p < 0.05, ## p < 0.01 vs. Obese, && p < 0.01 vs. Obese + DM.

