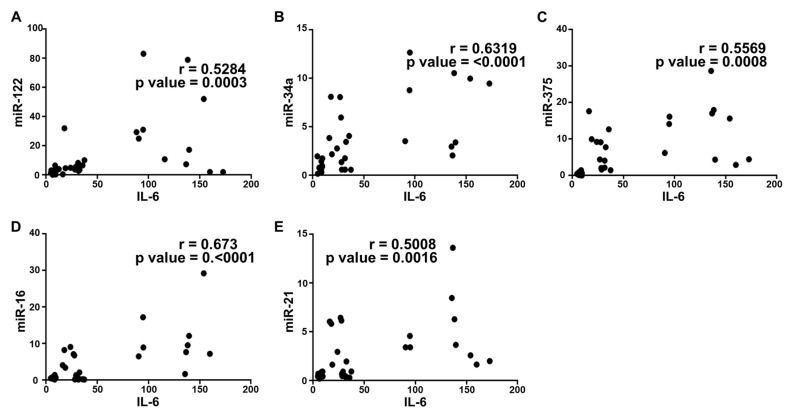
Figure 3.
Correlation analysis of IL-6 with circulating miRNAs expression. Correlation was determined using Pearson’s r coefficient choosing two tailed p-value to demonstrate significance (alpha = 0.05). Scatter dot plot between IL-6 and the following: (A) miR-122; (B) miR-34a; (C) miR-375; (D) miR-16; and (E) miR-21. Each plot independently shows corresponding correlation coefficient (r value) and significance (p value).

