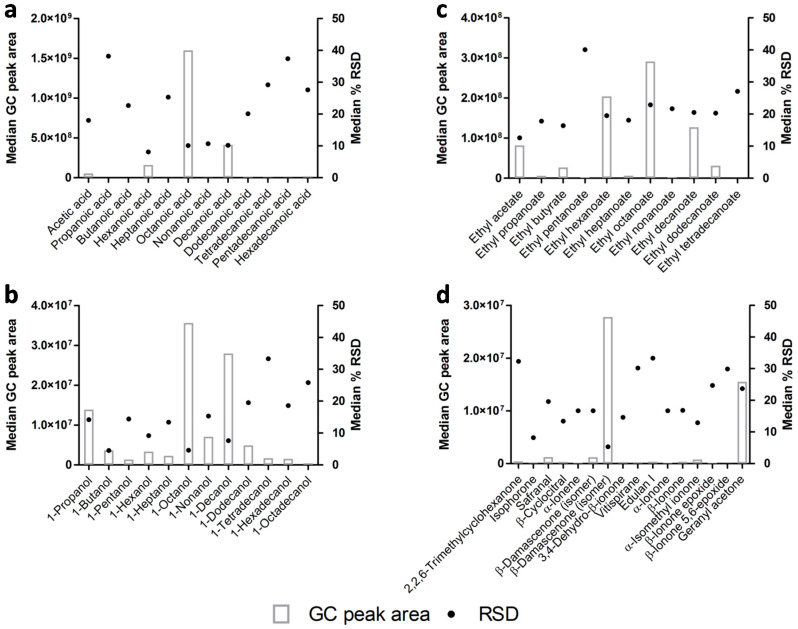
Figure 3.
Analytical variability of HS-SPME/GC×GC-ToFMS analysis of beer volatile metabolites, considering the GC peak area (grey rectangle) and RSD (black circle) for selected homologous groups, namely (a) acids, (b) 1-alcohols, (c) ethyl esters, and (d) norisoprenoids. Volatile metabolites were displayed by increasing order of molecular weight on x-axis, except norisoprenoids that contain volatile metabolites with equal molecular weights.

