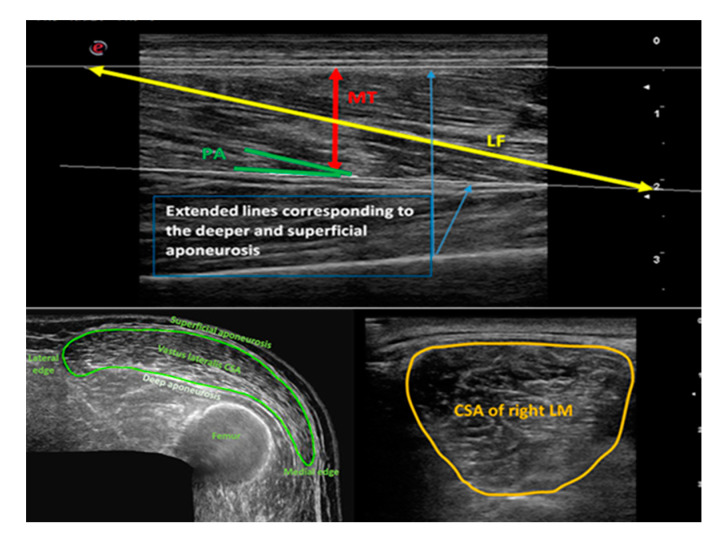
Figure 1.
Graphical representation of vastus lateralis and lumbar multifidus ultrasound image analysis. Upper panel: Measurement of vastus lateralis (VL) architecture (MT = muscle thickness; LF = fiber length; PA = pennation angle); lower panel: measurement of cross-sectional area (CSA) of VL and lumbar multifidus (LM) as traced by a cursor around the muscle border.

