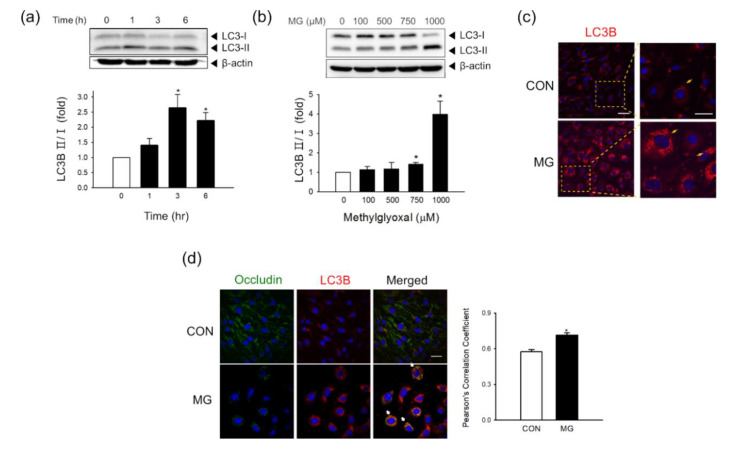
Figure 5.
Autophagy activity and co-localization of occludin with LC3B 24 h after MG exposure in brain ECs. (a,b) The protein levels of LC3B-I/II were determined (a) at 0, 1, 3, or 6 h after treatment with 1000 μM MG (n = 3) or (b) at 24 h after treatment with 0–1000 μM MG by western blotting (n = 4). (c) MG-exposed bEnd.3 cells were stained with an antibody against LC3B and visualized by confocal microscopy. Scale bar: 50 μm. (n = 4) (d) Co-localization of occludin with LC3B was analyzed after MG exposure using confocal microscopy. Scale bar: 20 μm. Pearson’s correlation coefficients were calculated from three independent experiments (n = 3). Representative images are shown. Data are presented as mean ± SEM. * p < 0.05 vs. control (CON).

