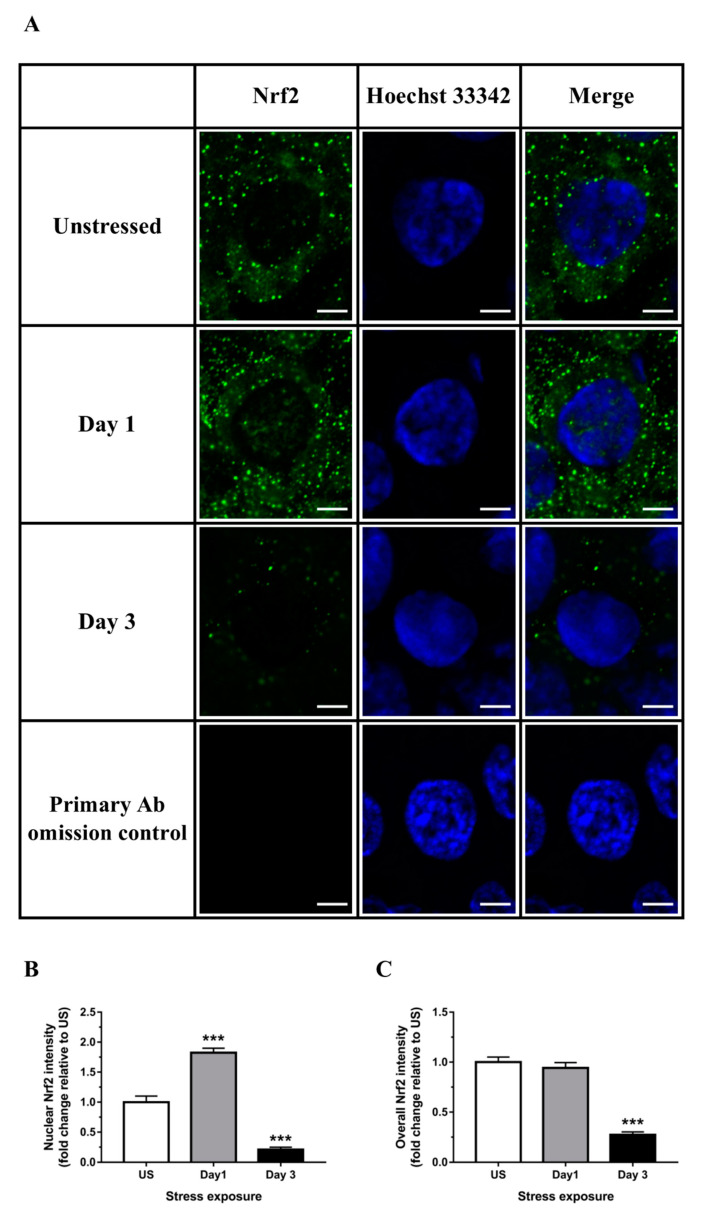
Figure 7.
Representative (A) immunofluorescence images (scale bar = 5 μm) and image quantification of (B) corresponding nuclear Nrf2, and (C) overall Nrf2 from tissue sections in the liver (n = 3). Results in (B) were analyzed using one-way ANOVA with Fisher’s LSD test. Data are expressed as mean ± SEM, *** p < 0.001.

