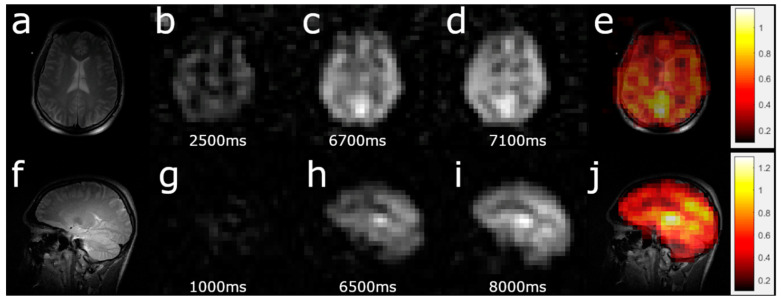
Figure 3.
Example of perfusion map acquisition. (a,f) High-resolution, T2-weighted 1H scans for brain localization. (b–d) Three dynamic HP 129Xe TOF images acquired 2.5 s, 6.8 s, and 7.1 s after the application of a depolarization radiofrequency pulse in the axial projection. The image artifact in the top left corner in b is from excess gaseous 129Xe at the end of the inhalation tube connected to the TedLar bag. The gradual signal-to-noise ratio increase can be observed with increasing wash-in time. The slope map was created by a pixel-by-pixel linear fit of the 129Xe brain images. (e) The perfusion map (measured in mL of blood per mL of tissue per min) created by the pixel-by-pixel recalculation of the TOF slope was used to calculate the sum of the perfusion rates of gray and white matter superimposed on top of a high-resolution proton brain image. The calculated values of perfusion agreed with previously observed values [41,46]. (g–i) Three dynamic TOF images acquired after 1s, 6.5 s, and 8 s TOF in the sagittal view. (j) Perfusion map in the sagittal view. Similar to e, the intensity values were the net sum of the white and gray matter perfusion rates.

