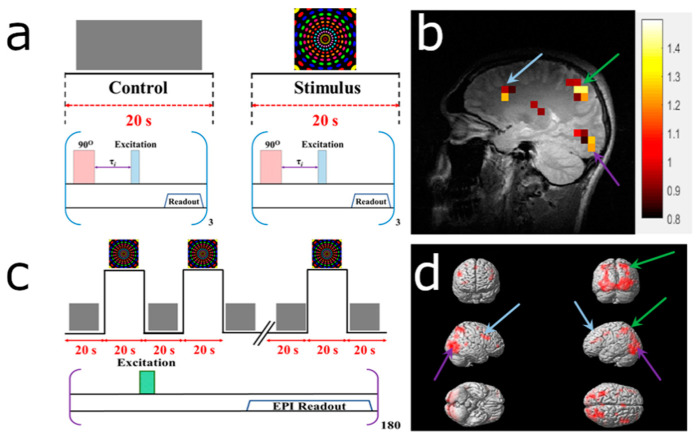
Figure 4.
Detection of a hemodynamic response from a colorful visual stimulus using HP 129Xe perfusion mapping validated by blood oxygenation level-dependent (BOLD) functional brain MRI (fMRI). (a) Experimental design used for hemodynamic response detection. Two separate perfusion maps were acquired during the control (gray screen) and visual stimulation. (b) Hemodynamic response map created by subtracting the control perfusion map from the stimulated perfusion map and overlaid on top of a high-resolution proton scan. Activation of the occipital lobe, superior parietal lobe, and frontal gyrus was observed. (c) BOLD fMRI experimental design for validation of the HP 129Xe technique. (d) BOLD fMRI 3D activation maps demonstrate a correlation with a 129Xe hemodynamic response map. The activated areas are indicated by colored arrows. The matched activated areas on the Xe image are indicated with arrows of the corresponding color.

