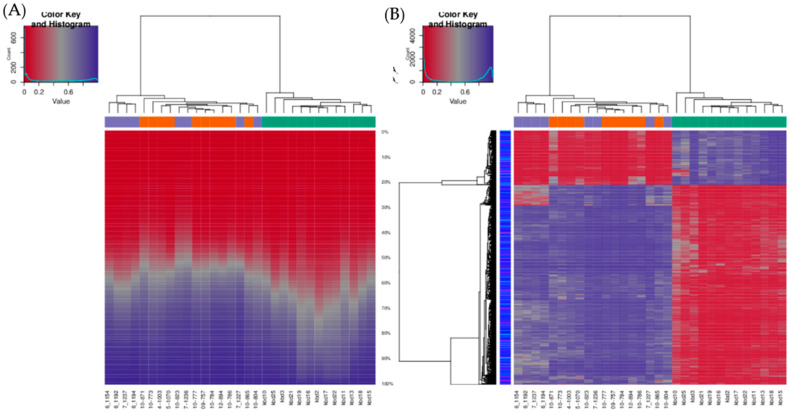
Figure 2.
Infinium MethylationEPIC BeadChip findings: Hierarchical clustering of samples based on all methylation values. (A) The heatmap displays methylation percentiles per sample. (B) The heatmap displays only selected sites/regions with the highest variance across all samples. Green: HNSCC samples, oropharyngeal cancer (n = 6) and oral cancer (n = 7), orange: Oral lesions, OLP (n = 8) and OLL (n = 2), violet: Healthy oral mucosa (n = 8).

