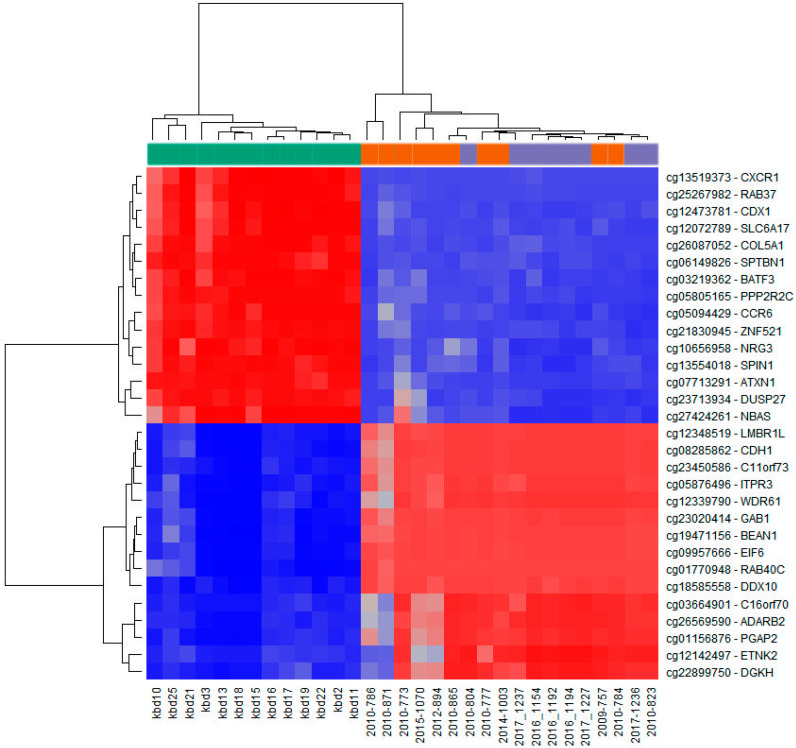
Figure 3.
Infinium MethylationEPIC BeadChip findings: Heatmap representation of samples clustering for the top fifteen hypermethylated (blue) and top fifteen hypomethylated (red) CpG sites in cancer tissue compared to control healthy tissue (according to the methylation difference value; Table 3 and Table 4). Left side (green): HNSCC samples (n = 13; kbd10–kbd11); right side (violet): Healthy oral mucosa (n = 8; 2010-804, 2017-1237–2017-1227, 2017-1236, 2010-823); middle (orange): Oral lesions (n = 10; 2010-786–2010-865, 2010-777, 2014-1003, 2009-757, 2010-784).

