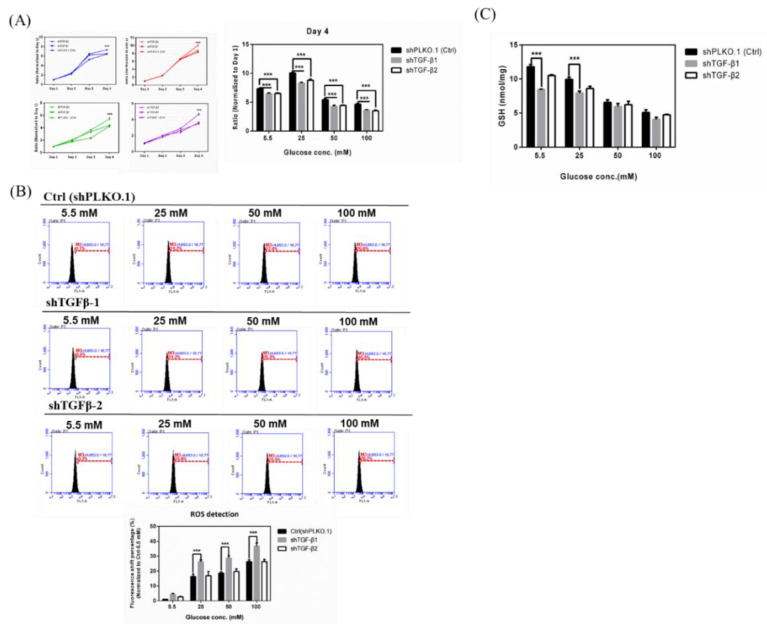
Figure 4.
Effects in TGF-β1/2 knockdown RGCs with hyperglycemia. (A) Left: Cell proliferation rates under different glucose concentrations were observed from Day 1 to Day 4 by cell viability assay. The data from Day 2, Day 3, and Day 4 were normalized to Day 1. TGF-β1/2 knockdown RGC-5 cells were incubated in 5.5 mM, 25 mM, 50 mM, and 100 mM glucose for 3 weeks or longer and plated into 96-well plates to observe the proliferation rate in different glucose concentrations. Right: Isolated Day 4 data show the differential proliferation rate in TGF-β1/2 knockdown in RGC-5 cells in four different glucose concentrations. Data are represented as mean ± SEM. ***, p < 0.001 when compared to shPLKO.1 (Ctrl). (B) Upper: iROS production in TGF-β1/2 knockdown RGCs with hyperglycemia. Intracellular ROS accumulations were assessed by the APF detection method in TGF-β1/2 knockdown RGC-5 cell cultures in long-term different glucose concentrations (5.5 mM, 25 mM, 50 mM, and 100 mM glucose). After exposure, 106 cells were treated with APF (5 μM) in PBS (phosphate buffered saline). Intracellular ROS generation was quantified by flow cytometry. (n = 3) Lower: Relative fluorescence shift percentage was quantified and normalized with respect to the shPLKO.1 (5.5 mM) group. Data are represented as mean ± SEM. ***, p < 0.001 when compared to shPLKO.1 (Ctrl). (C) GSH content in TGF-β1/2 knockdown RGCs with hyperglycemia. Dose responses involving total GSH levels in TGF-β1/2 knockdown cells treated with 5.5 mM, 25 mM, 50 mM, and 100 mM glucose medium were assayed. Data are represented as means ± SEM. ***, p < 0.001 when compared to the shPLKO.1 (Ctrl).

